Introduction of Multiparametric Analysis of Apoptosis
The importance of apoptosis in the regulation of cellular homeostasis has mandated the development of accurate assays capable of measuring this process. Apoptosis assays based on flow cytometry have proven particularly useful. They are rapid and quantitative; they provide an individual cell-based mode of analysis (rather than a bulk population). The multiparametric nature of flow cytometry also allows the detection of more than one cell-death characteristic to be combined in a single assay. For example, apoptosis assays that utilize DNA dyes as plasma membrane permeability indicators (such as propidium iodide) can be combined with assays that assess different cellular responses associated with cell death, including mitochondrial membrane potential and annexin V binding to “flipped” phosphatidylserine (PS). Combining measurements for cell death into a single assay has a number of important advantages; it provides simultaneous multiple confirmation of apoptotic activity (important in a process that has proven highly pleiotrophic in phenotype). It also provides a much more comprehensive and multidimensional picture of the entire cell-death process.
Recognition of the pivotal role of caspases in the death process has led to the recent development of assays that can measure these important enzymes in situ. Caspase activation represents one of the earliest easily measurable markers of apoptosis. In most cases, caspase activation precedes degradation in cell permeability, DNA fragmentation, cytoskeletal collapse, and PS “flipping”; caspases are in fact both signaling agents and mediators of these downstream manifestations of cell death. Combining fluorogenic assays of caspase activation with fluorescence-based assays for later characteristics of cell death (such as PS “flipping” and loss of membrane integrity) can provide a very information-rich view of cell death. It can be particularly helpful in distinguishing the “early” stages of cell death from later events, allowing better signal transduction studies in cells prior to the complete collapse of the cell structure.
Several fluorogenic assays for caspase activity have also been described, including the OncoImmunin PhiPhiLux system, the FLICA substrates, and the NucView substrates. All of these assays have both advantages and drawbacks. In this chapter, we describe the combination of the PhiPhiLux caspase substrate system with two simultaneous assays for later stages of cell death, annexin V binding to “flipped” PS residues, and cell membrane integrity using a DNA binding dye. The PhiPhiLux caspase substrates have several characteristics that make them useful for integration with other “live” cell apoptosis assays; they are cell-permeable and possess good caspase specificity. They are also relatively non-fluorescent in the intact state and become fluorescent upon caspase cleavage, with a signal-to-noise ratio of roughly 40 between the two states. They are also based on fluorescent probes with spectral characteristics similar to commonly used probes like fluorescein and rhodamine; this makes them easy to combine with other fluorescent probes. The ability to observe and measure multiple apoptotic phenotypes in a single assay gives a powerful picture of the overall apoptotic process. It is applicable to both suspension cells by traditional flow cytometry, and adherent cells using laser scanning cytometry. This assay can take advantage of newer flow cytometers with multiple lasers, but is also accessible to older cytometers with a single 488 nm laser.
Methods of Multiparametric Analysis of Apoptosis
Combinations of Fluorochromes
This assay combines fluorescent labels for three characteristics of cell apoptosis, namely caspase activation, PS “flipping”, and cell permeability. There is considerable flexibility of fluorochrome selection for the investigator depending on the flow cytometric instrumentation available. Three possible combinations are described below, one for analysis on instruments equipped with a single 488 nm laser, a second for instruments equipped with dual 488 nm/red diode or red HeNe lasers, and a third for instruments equipped with a violet laser diode.
Single 488 nm Laser Instruments
These instruments are limited to a single laser, and tend to have only three or four fluorescent detectors. Examples of these include: flow cytometers from BD Biosciences such as the BD FACScan, single laser FACSort or FACSCalibur; flow cytometers from Beckman Coulter such as the Coulter Epics XL or Cell Lab Quanta. The following combination should be used when analysis is limited to this instrument type:
- PhiPhiLux G1D2 (similar to fluorescein): Detect this fluorochrome in the fluorescein or FITC detector on most commercial instruments.
- PE-conjugated annexin V: Detect this fluorochome in the PE detector on most instruments. Apply fluorescence compensation to separate the PE signal from PhiPhiLux G1D2 and 7-AAD.
- 7-AAD: Detect this far-red emitting DNA binding dye in the far-red (or PE-Cy5) detector on most commercial instruments.
Dual 488 nm/Red Laser-Equipped Instruments
Several more recent benchtop flow cytometers are equipped with more than one laser, most commonly a red source (such as a 635 nm red diode or 633 nm red HeNe laser). The BD FACSort, FACSCalibur, LSR, and LSR II fall into this category, as do the FC500 and Accuri C6. A red laser allows several red-excited fluorochromes to be incorporated into flow cytometry assays, including APC. Another group of PhiPhiLux caspase substrates incorporating a proprietary red-excited fluorochrome analogous to Cy5 can also be used on these instruments. The DNA dye Sytox Red can also be incorporated if a red laser is available. The following combination is suggested for dual laser instrumentation:
- PhiPhiLux G1D2 (similar to fluorescein): Detect this fluorochrome in the fluorescein detector on most commercial instruments.
- APC-conjugated annexin V: Excite this fluorochome with either a red diode or HeNe laser, and detect in the far-red range. Little fluorescence compensation is required to separate its signal from PhiPhiLux G1D2 or the DNA binding dyes described below, making post-acquisition analysis easier. Annexin V conjugates with Cy5 and Alexa Fluor 647 (which are spectrally similar to APC) can be analyzed in the same way.
- PI or 7-AAD DNA binding dyes can be incorporated into a cell-death assay with PhiPhiLux G1D2 and APC-annexin V. Detect both in the far-red detector (usually with a mid- 600 nm bandpass (BP) or longpass (LP) filter) on most flow cytometers.
- Further substitutions: If a red-excited DNA dye like Sytox Red is used, move annexin V to another detector (such as the PE detector).
Triple 488 nm/Red Laser/Violet Laser Diode-Equipped Instruments
Many modern cytometers are equipped with more than two lasers; violet laser diodes (~405 nm) are typically included as a third excitation source. Instruments include the BD LSR II, LSR Fortessa, Gallios, Stratedigm S1400, and Partec CyFlow. Violet-excited annexin V conjugates and DNA binding dyes can be easily incorporated into apoptotic assay combinations. Violet-excited probes do notsignificantly overlap into other fluorescence channels, making them very useful for multicolor assays. Two examples are listed below:
- PhiPhiLux G1D2 (similar to fluorescein): Detect this caspase substrate in the fluorescein detector. Combine it with:
- PI, 7-AAD or Sytox Red: Either a 488 nm or red-excited DNA binding dye can be used (multilaser cytometers are typically equipped with both red and violet laser sources).
- Pacific Blue-annexin V: Pacific Blue is a relatively bright violet-excited fluorochrome, and is available in an annexin V conjugate. Pacific Blue does not overlap significantly into other fluorescent channels, and other fluorochromes do not overlap significantly into it, making it very applicable for multiparametric assays.
- Another possible combination still uses the fluorescein detector for PhiPhiLux G1D2, but uses:
- Hoechst 33258 or Sytox Blue: These DNA binding dyes use the violet laser for excitation. Sytox Blue is somewhat more cell-permeable than Hoechst 33258, which is roughly equivalent to PI.
- APC-annexin V: A red laser can be used to excite APCannexin V. This combination uses three lasers to excite three fluorochromes; as a result, virtually no spectral overlap occurs, and almost no fluorescence compensation is required.
Preparation of Cells
EL-4 cells treated with transcriptional or translational inhibitors such as cycloheximide at 50 mg/mL or actinomycin D at 5 mg/ mL for 4 h. This cell line is easily grown and hardy, and can make a useful positive control for more general use (see Note 1).
- Harvest cell lines grown in suspension or cultured primary cells. Transfer cells to 12 × 75 mm cell culture tubes, and centrifuge at 400 × g for 5 min.
- Decant supernatant. Maximum removal of the supernatant is critical; the volume of remaining supernatant should be as low as possible to cause minimal dilution of the caspase substrate. Although cells can be washed prior to labeling, performing the assay in the remaining complete medium supernatant will reduce the amount of incidental cell death occurring during the assay. If cells are obtained from clinical or other in vivo sources, they should be centrifuged and resuspended in a complete tissue culture medium (such as RPMI containing 10% FBS) prior to use, then centrifuged, and decanted as described above.
- Label 0.5 to 1 × 10⁶ cells per sample; increasing this number will saturate the detection reagents and reduce caspase and annexin V labeling efficiency. Adherent cells pose special challenges for apoptotic analysis due to the physical trauma and membrane damage that occur with cell dissociation; analysis in the adherent state by laser scanning cytometry is much preferable to flow cytometry under these circumstances (see Note 4).
Fluorogenic Caspase Substrate Labeling
Cells are initially incubated with the PhiPhiLux caspase substrate. Substrate concentration and incubation time are critical factors in cell-permeable substrate loading.
- Ensure that as much supernatant is removed, to maximize final substrate volume. Tap each tube to resuspend the cell pellet in the remaining supernatant. The supernatant in the tubes will be approximately 50 mL in volume (but not exceeding 100 mL).
- Add 50 mL of the PhiPhiLux reagent to each tube and shake gently. The PhiPhiLux reagent should be diluted as little as possible for maximum detection, hence the need for minimal sample supernatant. PhiPhiLux reagent solutions are typically prepared at 10 mM; this will give a final concentration between 3 and 5 mM (in approximately 100–150 mL of total volume).
- Incubate the tubes for 45 min at 37°C, in a water bath or an incubator. An incubator may be preferred if CO2 conditions are desired. For both optimal labeling and reasons of economy, the PhiPhiLux reagent can be titered and tested for use between 0.5 and 5 mM. However, this should be done with caution (see Note 5).
Annexin V Labeling
Cells are then labeled with fluorochrome-conjugated annexin V. Since centrifuge washings are minimized in this method to reduce assay-associated cell death, the cells are not washed following caspase substrate loading, but are labeled immediately with fluorochrome-conjugated annexin V. Since most cell culture media and serum supplements contain calcium and magnesium, it is assumed that cation concentrations are sufficient to allow annexin V binding to “flipped” PS residues. However, this should be verified; even brief removal of divalent cations will cause immediate dissociation of the annexin V reagent. Subsequent cell washing is therefore done in PBS containing calcium and magnesium supplemented with FBS (see Note 6).
- After 45 min of caspase substrate incubation, add the appropriate fluorochrome-conjugated annexin V (in this case, either PE or APC). Annexin V is generally available in suspension at concentrations ranging from 0.1 to 1 mg/mL. Cell labeling should be carried out at approximately 0.5–5 mg annexin V per sample. Therefore, add 5 mL of a 1 mg/mL annexin V solution to the tubes. Again, fluorochrome-conjugated annexin V labeling should be titered in advance of actual use.
- Incubate at room temperature (or in a 37°C incubator if CO2 is desired) for 15 min.
- Add 3 mL of wash buffer to each tube. Centrifuge at 400 × g for 5 min, and decant supernatant.
DNA Binding Dye Labeling
Depending on the instrumentation available, cells can be subsequently labeled with a DNA binding dye for assessment of cell permeability in the later stages of apoptosis. Remember that 7-AAD can be used with single laser instruments. PE-annexin V and PI can be used together on a single laser instrument, but they are spectrally similar, and compensation of fluorescence may be an issue. 7-AAD is therefore preferable when using PhiPhiLux and PE-annexin V. PI is more readily used with dual-laser instruments (blue-green and red), since annexin V can be detected using the APC detector. Sytox Red requires a red laser; Hoechst 33258 and Sytox Blue require violet excitation. (See Note 3.)
- Prepare a solution of DNA binding dye in complete medium: PI at 2 mg/mL, 7-AAD at 5 mg/mL, Sytox Red or Sytox Blue at 5 mM, or Hoechst 33258 at 2 mg/mL.
- Add 0.5 mL of the DNA binding solution to each of the tubes. Maintain samples at room temperature and analyze within 60 min (see Note 7).
Flow Cytometric Analysis
Cells should be analyzed as quickly as possible to minimize post-assay apoptotic death. The instrument should be set up and ready for sample acquisition immediately upon completion of the assay. Although the cleaved caspase substrate has a lower membrane permeability than the uncleaved molecule, even the cleaved form will eventually diffuse into the surrounding medium. Samples should be kept at room temperature until analysis; storage at 4°C may reduce dye dissociation, but can itself induce unwanted apoptosis. The choice of fluorescent reagents for both single- and dual-laser flow cytometers; fluorescent detector assignments and analysis issues are described here.
- PhiPhiLux G1D2: This fluorescein-like caspase substrate is detected through the fluorescein detector on most flow cytometers (often with the designation “FL1”) using a 530/30 nm or similar narrow BP filter. The spectral properties of PhiPhiLux G1D2 is similar to fluorescein, requiring some spectral compensation when used simultaneously with PE or PI (and to a lesser extent with 7-AAD).
- PE-conjugated annexin V: Like most PE-conjugated reagents, this reagent is detected through the PE detector on most flow cytometers (often with the designation “FL2”) using a 575/26 nm or similar BP filter. PE requires some spectral compensation when used with PhiPhiLux G1D2 and 7-AAD.
- APC-conjugated annexin V: APC is excited with a red laser source and detected through the APC detector on many flow cytometers (sometimes with an “FL4” designation) using a 660/20 nm or similar BP filter. An advantage of APC in multicolor assays is its minimal need for color compensation; there is no significant spectral overlap between PhiPhiLux G1D2, PI, or 7-AAD. Cy5 or Alexa Fluor 647 conjugates are spectrally similar to APC, and can be analyzed in the same way.
- Pacific Blue-conjugated annexin V: Pacific Blue is analyzed using a violet laser; most instruments so equipped have at least two detectors aligned to this laser source. A 450/50 nm or similar filter is typically used to detect this fluorescent probe. Cascade Blue and Alexa Fluor 405 are spectrally similar to Pacific Blue, and are analyzed in the same way.
- PI: This DNA binding dye is very bright even at low concentrations, and has a broad emission range, requiring compensation when used with PhiPhiLux G1D2. It can be detected in either the PE (575/26 nm filter) or far-red detection channel (red 650 BP or LP filter). The second choice is preferable to reduce spillover into the fluorescein detector. PE and PI can be analyzed together on older single laser instruments using the traditional PE detector (“FL2” detector, 575/26 nm) for PE detection, and the longer PE-Cy5 detector (“FL3” detector, 650 LP dichroic, or 675/20 nm) for PI. However, the close proximity of their spectra makes this analysis difficult. Substitution of PI with 7-AAD is preferable. PI is highly charged, and will contaminate instrument tubing, causing unwanted “shedding” of the dye into later samples. After PI use, the instrument should be thoroughly cleaned with 10% bleach or similar detergent to remove the dye.
- 7-AAD: This DNA binding dye is not as bright as PI and emits in the far-red, allowing its detection in the far-red channel on most single laser flow cytometers (the PE-Cy5, or “FL3” detector) with a 675/20 nm BP, 650 LP dichroic or similar filter. Compensation will be required when used with PhiPhiLux G1D2 and PE.
- Hoechst 33258: Hoechst 33258 is very bright, and can be excited using either an ultraviolet or violet laser source. It is detected through a 450/50 nm or similar filter. It will have minimal spectral overlap into other fluorochromes. Like PI, it is highly charged and will adhere tightly to instrument tubing; the instrument should be cleaned thoroughly with 10% bleach or other detergent after use.
- Sytox Red and Sytox Blue: These dyes can be analyzed using the conditions for APC and Hoechst 33258, respectively. Both are very bright, and are somewhat more cell-permeable than PI or Hoechst 33258.
Gating for Flow Cytometry
Good gating is critical for meaningful analysis of apoptosis. Some guidelines are listed here.
- Scatter gating: Many cell lines and some primary cells show a dramatic alteration in forward and side scatter measurements late in the onset of apoptosis. Forward and side scatter are approximate indicators of cell size and optical density, respectively, and reflect both the cell volume loss and intracellular breakdown occurring during apoptotic death. It therefore seems logical to draw a gate around both the scatter-viable population AND the scatter-shifted apoptotic cells, and look at caspase activation, annexin V binding and DNA dye uptake in this total population. However, the scatter-apoptotic population is also usually at very advanced stage of apoptotic death; the cells are already positive for all markers. The advanced physical perturbation of the cells in this group can also produce positive, but highly variable labeling results, interfering with the identification of earlier apoptotic stages. It is therefore also useful to gate only on the scatter-viable cells, and examine early apoptotic markers such as caspase activation only within this group of cells. This dual approach allows an overall picture of both early and late apoptotic stages, as well as examination of the earliest apoptotic cells. It is therefore recommended that both gating approaches be applied to get a clear picture of the apoptotic process.
- Annexin V binding and DNA binding dye exclusion: Exclusion gating can also be useful for markers other than scatter. Annexin V binding and DNA dye uptake usually occur after caspase activation and are considered “later” markers of apoptosis. Therefore, subpopulations negative or positive for annexin V and DNA dye binding can be gated for discrimination of “early” and “late” apoptotic cells. The annexin V-negative DNA dye-negative cells can be gated as in step 1 to allow detailed examination of the earlier stages of apoptosis such as caspase activation.
- Differences in DNA dye permeability: DNA dyes are not completely interchangeable with regard to exclusion by apoptotic cells (see Note 3). For example, 7-AAD is somewhat more cell-permeable than PI and will label an earlier subset of apoptotic cells; the Sytox dyes will also label earlier apoptotic cells than either PI or Hoechst 33258. This will affect the overall analysis. For example, if 7-AAD-positive cells are excluded from the analysis (in an attempt to quantify very early apoptotic events), this dye’s greater cell permeability will result in a lower apparent number of caspase-positive cells that are DNA dye-negative than if PI were used instead. These differences should be kept in mind when analyzing these early apoptotic subsets.
- Caspase substrate background fluorescence: Viable cells labeled with a caspase substrate will have somewhat higher background fluorescence levels than completely unlabeled cells. Care should be taken to identify both the viable and apoptotic fraction without using an unlabeled control as a cutoff.
Simultaneous Immunophenotyping
The protocol described in this chapter is very compatible with simultaneous antibody immunophenotyping of the “viable” subpopulations. For example, PE-conjugated antibodies against a marker of interest could be combined with PhiPhiLux G1D2, 7-AAD, and APC-annexin V labeling as a very stringent “filter” for the removal of dead cells from the phenotyping analysis. This is similar to the common inclusion of PI or another viability probe in cell phenotyping protocols, to exclude dead cells from the analysis; incorporating a multicolor apoptotic assay with immunolabeling for dead cell exclusion is even more powerful. While a natural extension of this method would appear to be the immunophenotyping of early apoptotic cells (such as caspasepositive/ 7-AAD-negative/annexin V-negative), this should be approached with great caution (see Note 8).
Sample Results
In all of the illustrated results, apoptosis was induced in EL-4 murine thymoma cells by treatment with either actinomycin D or cycloheximide for 4 h. These drugs rapidly induce apoptosis via the caspase 3 pathway in many rapidly dividing cell lines. The figures both illustrate expected results for the individual components of the multiparametric cell-death assay, and demonstrate how the simultaneous analysis of multiple cell-death characteristics in a single assay gives a multidimensional picture of the total apoptotic process.
- Forward and side scatter: A typical shift in forward and side scatter during apoptosis in EL-4 cells treated with actinomycin D. In this case, both the entire population (excluding debris) and the scatter-viable cells are gated, and subsequently analyzed for caspase activation, annexin V binding, and DNA dye permeability.
- Fluorescence distribution of PhiPhiLux G1D2 labeling: The typical signal-to-background ratio between “viable” and apoptotic EL-4 cells labeled with the PhiPhiLux G1D2 substrate (shown here without annexin V and DNA binding dye labeling). The caspase substrate was readily detectable in the fluorescein channel by flow cytometry, in this case on a BD FACSCalibur. The substrate is much less fluorescent in the uncleaved state; signal-to-noise ratios of 1- to 3-log orders of magnitude are normally seen between “viable” and apoptotic cells loaded with PhiPhiLux G1D2. Unlabeled cells are slightly less fluorescent than “viable” labeled cells; this background fluorescence can be more dramatic in some cells types and does not necessarily indicate caspase activity in viable cells.
- It should be noted that the “viable” and apoptotic distribution based on scatter measurements does not strictly correlate with caspase activation. The scatter-viable cells have a large percentage of caspase-positive cells, indicating that cells activate caspases prior to gross changes in scatter morphology. In some cases, the scatter-apoptotic population may also have some caspase-negative cells. While some of these cells may be advanced apoptotic or necrotic cells with diminished or degraded caspase activity, there may also be viable cells in this population. Previous studies have shown that cells may undergo transient volume fluctuations very early in the apoptotic process, well before caspase activation. These results indicate the importance of gating on both the total scatter-viable/ apoptotic population, as well as the scatter-viable only cells.
- PhiPhiLux G1D2 and 7-AAD labeling: The addition of the DNA dye 7-AAD labeling to the PhiPhiLux G1D2 assay. The dot plots at the top of the figure show 7-AAD labeling versus caspase activation for both drugtreated EL-4 cells gated for either the entire population (left dot plot) or the scatter-viable cells. Even with only two probes for apoptosis, three distinct subpopulations were apparent: a “viable” population at lower left, a caspase-positive population that had not progressed to 7-AAD permeability (lower right), and a caspase-positive population that was permeable to 7-AAD (upper right). Sometimes, a fourth population is also apparent that is also labeled with 7-AAD, but had little caspase activity. If present, this fourth population of cells likely contained necrotic or advanced apoptotic cells, where caspases had leaked out of the cells, or were proteolytically digested. Another important potential source of this population is cells that have undergone apoptosis in the incubation period following PhiPhiLux labeling but prior to flow analysis. Cells in this region demonstrate the importance of analyzing cells promptly at the completion of the assay, since apoptosis is still occurring. It also illustrates the importance of minimizing cell trauma during the assay; centrifugations and pipet transfers should be kept to a minimum.
- At this point, the investigator can either include in the analysis all cells based on scatter (left column), or only the scatter- viable cells (right column). Excluding the advanced apoptotics can allow better resolution of the early-stage apoptotic cells. In addition, DNA dye labeling can now be used to exclude the more advanced apoptotic cells for specific measurement of the earlier dying cells. The bottom row of histograms show caspase 3/7 levels in 7-AAD negative cells. Caspase activation clearly precedes DNA dye permeability in this cell type.
- PhiPhiLux G1D2, 7-AAD and APC-annexin V labeling: The final simultaneous analysis of caspase, annexin V, and DNA dye in a single assay. The left dot plot shows the forward and side scatter profile for apoptotic EL-4 cells; the entire cell population is then gated into a dot plot for annexin V binding versus DNA dye permeability (middle dot plot). Either the entire cell population or the annexin V-negative 7-AAD-negative cells can then be displayed for caspase 3/7 activation. A significant population of caspasepositive cells is present even in the annexin V-negative 7-AADnegative population; caspase activation again precedes both of these characteristics. Layering multiple apoptosis assays into a single multiparameter assay therefore allows a comprehensive assessment of the apoptotic process in a cell population.
- Detection of multiple caspases by flow cytometry: The PhiPhiLux system can incorporate a number of both consensus peptides for different caspase specificities, and fluorochromes for flow cytometric detection. It is therefore possible to load cells with more than one PhiPhiLux reagent, if they possess specificity for different caspases, and if they can be spectrally distinguished from one another by flow cytometry. The three substrates used were modifications of the PhiPhiLux reagent described earlier. Cells were simultaneously loaded with PhiPhiLux L1D2 (specific for caspase 8, conjugated to a fluorescein-like fluorochrome), PhiPhiLux R2D2 (specific for caspase 3/7, conjugated to a Cy5-like probe), and PhiPhiLux E2D2 (specific for caspase 1, conjugated to a rhodamine-like probe). The substrate concentrations were increased to allow simultaneous loading with all three substrate conjugates while maintaining the 3–5 mM concentration specified. A BD LSR II equipped with 488, 561, and 405 nm lasers was used to excite this combination of fluorochromes. The 561 nm laser was used to excite the rhodamine-like substrate, and provided adequate excitation for the Cy5-like substrate as well. Cytometers equipped with 532 and 561 nm lasers are now commercially available and becoming more common, giving access to these alternative substrate conjugates. The rhodamine caspase 1 substrate used in this example was readily excited at this wavelength.
- Multiple caspase results and probability state analysis: The three-caspase activation profile, gated for the apoptotic (Hoechst 33258-negative) cell population. Caspase activation was clearly not simultaneous; caspase 1 and 8 are activated first, followed by caspase 3. This was confirmed using the probability state analysis software GemStone, which plots changes in flow cytometric parameters as functions of time, relative to a computer model. This analysis is shown caspase 1 and 8 are upregulated prior to caspase 3. By using multiple lasers and caspase substrates conjugated to multiple fluorochromes, multiparametric assays for apoptosis can become much more informative. This modification to the multiparametric cell-death assay allows an even earlier stage of cell death to be distinguished and identified. Rather than just assaying for cell viability, investigators can collect important information about the signal transduction and effector processes of apoptotic death.
These collective results are consistent with many immune cell types and established cell lines; however, wider variations in apoptotic phenotype between different cell types should be expected (see Note 9).

 Loading ......
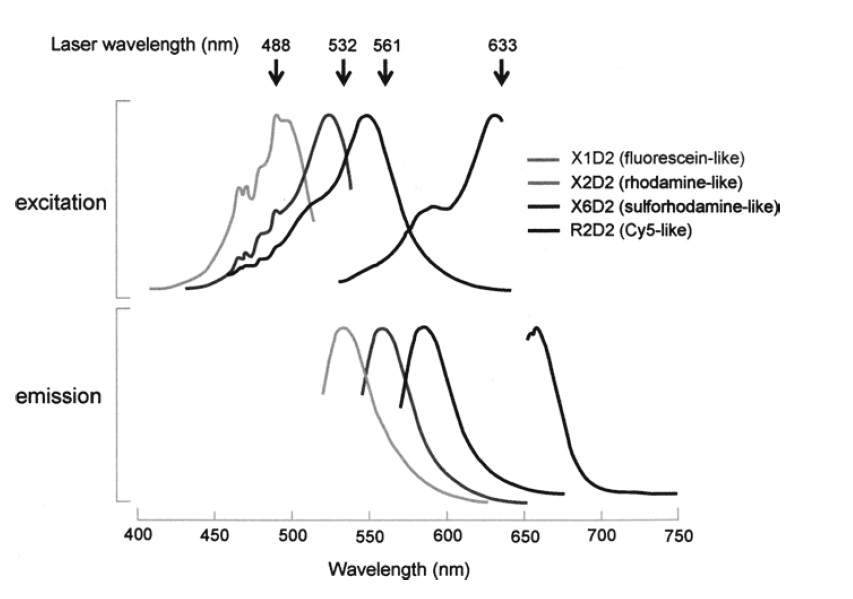 Figure 1. Spectral characteristics of fluorogenic caspase substrates.