
Inquiry Basket
 Loading ......
For yeast and drosophila cell lines, most published work is simple in cytometric terms, usually using DNA binding or other dyes in single or two color assays, e.g., live/dead assays using Hoechst 33342 and PI. See ref. for an interesting application of imaging flow cytometry for cell cycle analysis of budding yeast. This chapter refers only to mammalian cells.
Four common reasons for cytometric cell cycle analysis are to determine the fraction of proliferating cells, the fractions of cells in kinetic compartments (phases, subphases, and states), compartment transit times, or the cell cycle-related expression of a biochemical activity. In the same order, examples of each modality are: (1) stimulated lymphocyte assays, dye labeling dilution, and proliferation antigen detection; (2) S phase fraction analysis of tumors and hematopoietic malignancies; (3) G1 timing; and (4) SV50 large T antigen and cyclin B1 expression.
Simple cell cycle analysis consists of DNA content measurements. By itself, this is insufficient for measuring the fraction of proliferating cells or complete phase fraction analysis. Quiescent or G0 cells have the same DNA content as G1 cells, and when assaying cell populations that contain nonproliferating and proliferating cells, the best that can be achieved by DNA content measurements is to obtain a proliferation index by quantifying the S phase fraction. A better assay is to measure the S fraction of labeled cells after continuous labeling over some time period beyond the expected length of the G1 phase (thus, all cycling cells will be labeled). Equally, the 4C fraction can be composed of G2, M, and endoreduplicating or binucleate G1 cells from a subpopulation cycling from 4C→8C. A common mistake in literature describing drug and radiation treatments that perturb G2 and M transit is either failure to realize or failure to communicate that the increased fraction of “G2 + M” cells can contain a substantial fraction of 4C G1 cells.
The limitations of DNA content measurements were overcome over a 20-year period from 1985 through 2005. During this time, the value of monoclonal antibodies as specific, quantitative probes for epitope expression in fixed cells and tissues became clear. The entire approach rests on one caveat that is difficult to validate – that is, that the probe detects an unbiased fraction of the epitope. Antibody assays are always performed as a function of something else. If the fraction of epitope that is available for reaction with the antibody is changing as a function of “that something else,” then the assay is subject to misinterpretation, unless that changing availability can be evaluated or measured. In lieu of direct validation, the caveat is supported by the large body of work that leads to the same answer whether the assay is done in tissue, whole cells, fractionated cells, or cell lysates. The level of possible “masking” (a description of unavailable epitope) follows the order tissue, whole cells, etc., therefore, the agreement between, e.g. , western blots and cytometry is relatively powerful validation.
After the caveat, the next weakness of the approach is the variability in antibody specificity and affinity. Before cytometric or microscopic assays can be relied on, the antibodies involved need to be validated. There are many published examples wherein this was not done. For a critical analysis of one group of widely used antibodies to the p53 protein see ref.
The methods for validating an antibody are not standard and not established. In 2009, many commercial antibody catalog sites still do not present validating data. For those that do (of which we are familiar), the data are never quantitative, always visual, always anecdotal, never rigorous, and not universally applied – i.e., they sell some with and some without evidence of validation. One assumes that the most common method of screening monoclonal antibodies is by ELISA using the purified antigen. This may be fine for producing antibodies that work for immunoblots that get around cross-reactions peptide/protein fractionation, but for cell-based assays in which specific and nonspecific reactions are either integrated (as in flow cytometry) or only crudely differentiable (i.e., by low resolution localization), it is not sufficient for validation. In cytometric assays, the quality of a reaction is defined by the antigen–antibody avidity versus nonspecific binding and cross-reactive binding to other cell constituents. It is avidity that matters because the increased probability that one or the other antigen combining site is bound significantly reduces the antibody off rate, even though most of the antibody is most likely bound monovalently at any one time. For epitopes on infrequent cells in heterogeneous samples like blood and bone marrow, the ratio of epitope to nonspecific binding sites is very small, therefore, the antibodies should be tested and staining optimized in these samples. Obviously, this level of assay-specific validation and optimization would be difficult and costly for commercial enterprises to perform, therefore, it is left to the investigator to validate antibodies when using them in previously unvalidated circumstances.
Our approach to validation is the following. First, we preferentially choose antibodies from companies that we trust and that provide some evidence for specificity. Generally, at a minimum, that means a western blot of whole cell lysates for positive and negative cells with the full molecular weight range displayed. If the epitope is localized in the cell, and/or modulated by drug treatment, evidence of correct localization and/or modulation will lead us to choose one antibody over another. After choosing an antibody, we perform both immunoblot and flow cytometric titers with negative and positive cell samples (if a negative cell source is unavailable, we default to a negative control with a secondary antibody). We design these with sufficient concentration points to generate a curve so that we can evaluate signal to noise. Third, we try to obtain a biological test – siRNA knockdown, gene transfer, virus infection, cytokine stimulation, drug treatment, etc. Fourth, we either perform fluorescence microscopy or laser scanning cytometry to make some check on localization. The working concentrations are defined by the cytometric titration. If our endpoint analysis is laser scanning cytometry, then we retiter by twofold dilutions around the concentration determined by flow cytometry. This is because we work with higher staining volumes and volume matters to the signal to noise ratio.
Unlike immunophenotyping, most of the interesting epitopes for cell cycle analysis are inside the cell. This means cells have to be stabilized (fixed) – proteases, nucleases, transporters, channels, and other active molecules need to be inactivated, and the cell needs to be made permeable to large molecules. This has been reviewed extensively. Briefly, in our opinion, there are two basic modalities. The first uses denaturation and begins with formaldehyde fixation sufficient to stabilize cells, and then is followed by alcoholic dehydration. For epitopes that are sensitive to formaldehyde, the formaldehyde step can be omitted because the denaturation process inactivates all the activities that formaldehyde inactivates. The second modality is nondenaturing, using formaldehyde followed by nonionic or zwitterionic detergent, or saponin. In this case, the formaldehyde is not dispensible because it also serves to cross-link molecules, creating a matrix through which large molecules diffuse slowly – thus, allowing staining and measurement of even soluble epitopes. Nothing used in this latter process efficiently denatures large molecules, and therefore, this is a native state system. In both processes, some molecules are extracted rather completely, some partially, some displaced. If the target epitope is involved in tight binding to other molecules, denaturation may be required to “unmask” the epitope. If enough formaldehyde is used for a long enough time, it is possible to make penetration of antibodies difficult, and it is possible to promote “masking” relative to cells fixed with less formaldehyde. In all of this, there are many variables that can be played with. For example, different salts can be used to differentially extract molecules during the fixation step. Another example is to permeabilize with detergent first then fix with formaldehyde and alcohol. This removes loosely bound proteins and other molecules. Use of the latter protocol gives a pattern of PCNA staining coupled with DNA staining that identifies S phase better than DNA staining alone. Two elegant studies using this approach are the exploration of new cell cycle states defined by correlated analysis of Ki-67 and PCNA and correlated analysis of Mcm-6 and PCNA.
In our opinion, there have only been two advances in the development of fixation/permeabilization methodology in recent years. The first is described in a paper by Chow et al. that identifies an alcoholic denaturing procedure that works on whole blood or bone marrow, leaving light scatter patterns and surface staining intact enough to identify the major subpopulations by standard immunophenotyping procedures. The second has a similar goal and is described in a patent awarded to Keith Shults and uses heat as the denaturant. A third effort, while not development per se, is worth mentioning: Krutzik and Nolan did a careful analysis of several fixation/permeabilization variants and arrived at formaldehyde followed by MeOH as the overall best general approach to phosphoepitopes.
To see a recent short review of cell cycle analysis by cytometry, see ref. In the following sections, a single protocol is presented to identify cell cycle states in mitosis, using one cell line. The variations on this same theme can be extended indefinitely by multiple staining for the many epitopes that play an important role in cell cycle regulation, and therefore, create interesting patterns in multiparameter cytometric assays. For other markers of mitosis, see refs. Additionally, for a very large number of very high quality, specific cell cycle assays, one could start in no better place than to consult the work of Zbigniew Darzynkiewicz, Frank Traganos, and their colleagues.
Abbreviations used in this chapter are: A488 Alexa Fluor 488, A647 Alexa Fluor 647, APC/C anaphase promoting complex/ cyclosome, bp band pass, C the genome complement, DAPI 4’,6-diamidino-2-phenylindole, FSC forward scatter, PE phycoerythrin, PHH3 phospho-S10-histone H3, PI propidium diiodide, FITC fluorescein isothiocyanate, SSC side scatter, UV ultraviolet.
1. In the example here, cells are growing exponentially as a suspension. Molt4 cells do not adhere to the dish, but many hematopoietic cells lines do adhere loosely. Gentle pipetting is used to remove these cells.
2. To obtain an exponential culture, Molt4 cells should be serially passaged with splits of 1–2 every 2–3 days if cells are approaching their upper density of 2 × 10⁶/mL. Cultures should be split before reaching 2 × 10⁶/mL otherwise cells begin to die as the culture becomes denser.
3. Examine with phase contrast inverted microscope. Cells should be free floating single cells. To obtain an even cell suspension, repeatedly pipette the culture. Pipette cells into a large test tube (15 or 50 mL) for cell counts (necessary if pooling flasks/dishes for large numbers of cells) and/or volume adjustments (see step 4).
4. Count the cells. Adjust cell concentration to 2 × 10⁶ either by adding media or centrifuge to concentrate and then add media for correct density. 5. Dispense aliquots of 2 × 10⁶ cells to 1.5 mL microfuge tubes. This works for antigens that are not labile during processing. If they are (e.g. some phospho epitopes), then formaldehyde is added directly to the tissue culture vessel or the collection test tube prior to counting the cells in a sufficient quantity (generally, 0.125 – 1%) to inhibit changes in the epitope. After addition of formaldehyde, the protocol is the same as what follows.
1. Move to cold room. All the lab procedures after cells are removed from the incubator and counted are in a cold room at 4°C. Pipettors, pipette tips, PBS, PBS-BSA reside at 4°C in the cold room (see Note 6).
2. Pellet (centrifuge for 30 s to1 min) then wash with 1.0 mL PBS. Resuspend in 50 mL PBS.
3. Add 450 mL MeOH (stored at −20°C). At this point, samples can be stored (see Note 7).
1. Pellet cells from fixative and aspirate supernate. Wash cells twice with 1.0 mL PBS and then wash once with 0.5 mL PBS-BSA. The second wash is to begin the blocking process.
2. Resuspend pellet in 50 mL PBS-BSA containing 0.125 mg anticyclin A2-PE, 0.06 mg anti-cyclin B1-A647, and 0.0125 mg anti-phospho-S10-histone H3-A488 (see Note 8).
3. Incubate at 37°C for 30–90 min (see Note 9).
4. Cool to 4°C then wash two to three times (in cold room) with 0.5 mL PBS-BSA (see Note 10).
5. Resuspend in 0.5 mL of DAPI solution.
1. Use any flow cytometer with UV or violet, blue, and red lasers. We use a BD Biosciences LSR II with a standard filter configuration. UV and Violet laser: 450/40 bp; 488 nm laser: 530/30 bp; red laser: 670/40 bp.
2. A standard set up at the BD LSR II in laboratory.
3. Forward and side scatter are plotted and the voltage adjusted to put each on scale. Note that the black dots are mitotic cells; mitotic cells are large (about 2× bigger than the average G1), and the correlation between forward and right angle light scatter is verified.
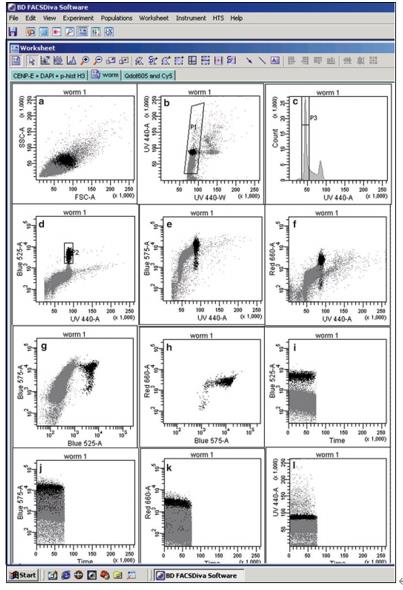 Figure 1. Display at the instrument during data acquisition.
4. The DAPI integrated and peak or width signals at 440 nm from the UV and violet lasers are plotted to form a “doublet discriminator.” A gate is set around the singlets (see Note 11). The purpose of this plot is to center the G1 peak at one-fifth the integrated signal maximum scale and to clean up the subsequent histograms.
5. A single parameter plot of the integrated DAPI signal from the UV and violet lasers is plotted to check the G1 position more precisely.
6. From this point on, all histograms are plotted using the integrated signals.
7. Phospho-S10-histone H3 (PHH3) is plotted versus DAPI and a mitotic gate is set and color coded. In the example, the mitotic events are black. The PHH3 signal is set to put the G1 cells in the first or second decade. This may be readjusted later.
8. Next, cyclin A2 versus DAPI is plotted. This is done to put the G1 cells in the first or second decade. The G2 and M cells should be tenfold or more intense. The pattern of negative G1 cells and linear expression through S phase with an additional increase in G2 appears to be universal, and therefore, we check the pattern to ensure that culture, fixation, and staining went well.
9. Next, cyclin B1 versus DAPI is plotted. This is done to put the G1 cells in the first or second decade. The G2 and M cells should be 10- to 15-fold more intense. The pattern of negative and positive G1 cells and exponential increase in S at one rate and in G2 at an increased rate also appears to be universal, and therefore, we also check that pattern (see Note 12).
10. We also plot PHH3 versus cyclin A2. This is done primarily to fine tune the voltage settings for A488 and PE. In the example, compensation was not required, but normally, one can expect the PHH3 signal to be very bright, and for some software to work well the subtraction of A488 from PE should not be more than 100%. Therefore, if one bisects the plot with a diagonal line from the origin to the upper right corner, then the bright mitotic cells should be on the upper side of that diagonal, when the control sample is run (control is stained only with PHH3 and DAPI).
11. We also check the cyclin B1 versus cyclin A2 pattern for the mitotic cells. This also appears to be universal and looks like a clockwise rotated “L” (see Note 12).
12. Finally, we plot each fluorescence parameter versus time to determine the stability of the run. For whatever reason (we think it is temperature change), dim signals often decrease as a function of time during the run. If it appears severe, we restart the run. If it is not severe (here it is not), then we note it. This can be corrected during analysis.
13. Generally, we set a region around a population of interest. If that population is rare, our goal is to collect at least 400 events, or as in this case, as many events as we can. The region of interest here defines the mitotic cells, and we have color coded the mitotic events black.
14. Analysis is done offline.
1. There are three things that can be obtained from these data. The first is the percentages of cells in different cell cycle phases or states. The second is the intensity of expression of the epitopes that have been measured in any phase or state, and the third is the entire cell cycle-related expression of those epitopes.
2. The doublet discriminator has been recapitulated – this time using signal peak height rather than width, and a region has been set around the singlets (R1). All signals after this are integrated (area) values. Here, we use the integrated signal from the violet laser and the peak from the UV laser because the violet laser was apparently sharply focused but wide (integrated and peak are equivalent) and the UV laser was apparently not as well focused but narrow (integrated and peak are not equivalent). We do not know the reason, but on any given day, one laser performs better than the other.
3. The histogram (PHH3 vs. DAPI) has been gated on R1, and a region has been set around the mitotic population (R2). This is a hyperlog plot, and some of the PHH3 signal has been subtracted as a function of side scatter.
4. The histograms (cyclin A2 vs. side scatter) shows the “before” (2C) and “after” (2D) for subtraction of background from the cyclin A2 negative G1 cells. Note that this centers the G1 cluster around “0” cyclin A2. This is a convenient analytical bottom to the data for cyclin A2 expression. This same procedure was applied to cyclin B1 expression (not shown), and PHH3 expression in G1. For the cyclins, this procedure is relevant to the biology since cyclins A and B are expressed below the level of detection in most of G1. Since PHH3 expression is real in G1, the interpretation of this is that we are setting interphase expression of PHH3 plus background to approximately zero. If the interphase levels of PHH3 were the focus of a study, we would subtract background based on a control antibody. Here, the subtraction is used to obtain cleaner plots of mitotic PHH3.
5. Cyclin A2 versus DAPI has been plotted for the interphase cells only by applying the logical gate R1 NOT R2. A contour region (R3) has been set at the 99% data boundary to exclude the 4C → 8C interphase population and 2C → 4C cells in S phase without cyclin A2. We do not know the origin of these cells, but likely they are either damaged, dying, or dead at the time of fixation.
6.The 2C → 4C interphase population has been plotted in density mode with labels identifying the G1, S, and G2 clusters. An additional gate (R14) has been set around an expanded version of cyclin A2 versus DAPI to clean the distribution further (not shown). It amounts to shrinking R3 to 99% of 99% to eliminate outliers.
7. PHH3 versus DAPI plotted using a logical Gate1 = (R1 AND R3 AND R14) OR R2. This has the effect of adding the 2C → 4C interphase cells to the 2C → 4C mitotic cells. This process has subtracted the 4C → 8C cycling population, apoptotic, cells, and outliers from the analysis.
8. Regions have been set around the G1, S, and G2 cells of the 2C → 4C stemline population
9. PHH3 versus cyclin A2 has been plotted (using Gate1) and regions set to include the cells in which PHH3 expression was increasing (R7) at the time of fixation and those in which it was decreasing (R8) at the time of fixation.
10.The expression of cyclins A2 and B1 for only the 2C → 4C mitotic cells (gated on R2). Note that we do not gate on R1 AND R2 because late telophase and cytokinetic cells that have not separated can register as doublets. The probability that R2 cells are doublets is relatively nonexistent because PHH3 positive or half-positive doublets would register at 6 and 8C. Also see ref. In this plot, regions were set on mitotic cells that express cyclins A2 and B1 maximally (R9); cells in which cyclin A2 was undergoing APC/C-mediated degradation and cyclin B1 remained at maximum at the time of fixation (R10); cells in which cyclin A2 has been degraded to background levels – essentially negative, and cyclin B1 was at maximum or beginning to be degraded by APC/C (R11); cells in which cyclin B1 was being degraded by APC/C (R12), and cells in which cyclin B1 has been degraded to background (R13).
11.Each of the regions, R4–R13 have been color coded and a 3D plot that traces the cell cycle “worm” can be traced through the three-dimensional state space defined by the expression levels of cyclins A2 and B1 and phospho-S10- histone H3.
12. We have named the states that we have defined in mitosis P1–3 (R7), P4 (R9 NOT R7), PM (R10), M (R11), LM1 (R12), LM2a (R13 NOT R8), and LM2b (R8). These correlate with prophase (P1–3 and P4), prometaphase (PM), metaphase (M), anaphase > telophase (LM1), and telophase + cytokinesis (LM2). The correlations have been verified by cell sorting and microscopy, inhibitor treatments, and laser scanning cytometry (to be published elsewhere). However, despite the correlation, these biochemical states should not be equated with the stages of mitosis, but thought of as biochemically defined transition states. For a review/commentary piece on mitotic states and stages, see ref. In this example, these measurements were done for three independently processed samples from the same culture. The accuracy is fairly remarkable considering that the frequencies span nearly three orders of magnitude.
13. Although we are not showing it here, the frequency of cells for each region (state) can be plotted on the X -axis, and the corresponding levels of each marker within each state plotted on the Y -axis to obtain the continuous expression of the marker as a function of time in the cell cycle. The frequency data needs to be corrected for the aging of the population, but even without the correction, this calculated expression profile is likely to be more accurate than that which can be achieved in the more standard, nonquantitative practice of synchronizing cells, releasing them, then measuring total expression levels as a function of time by western blot.
Reference
Loading ......
