Introduction of Immunophenotyping of Hematolymphoid Neoplasia
Flow cytometry immunophenotyping (FCI) analysis has many uses in the diagnosis and treatment of hematologic neoplasia. Some of these include (1) diagnostic support and subclassification of hematolymphoid neoplasia; (2) detection of antigenic expression on tumor cells that may be important for prognosis or therapy (e.g., ZAP-70 or CD38 on CLL cells, CD52 expression on tumor cells); and (3) clinical management through detection of minimal residual disease or recurrence. Additional medical indications for FCI include clinical symptoms suspicious for malignancy (e.g., lymphadenopathy, organomegaly, and tumor mass) and abnormal clinical findings (e.g., cytopenias, lymphocytosis, and presence of morphologically atypical cells or blasts on peripheral smear or biopsy material). FCI is less useful for conditions associated with sampling difficulties, i.e., a sequestered tumor source (non-circulating, localized tumors), a paucity of viable tumor cells (e.g., necrotic tissue), increased cellular fragility, or insufficient tumor yield (e.g., Hodgkin lymphoma or patchy disease distribution).
Proper collection, processing, analysis, and correlation with ancillary testing are crucial to quality FCI. Adverse storage conditions or use of fixatives before staining could damage the cells of interest or alter the specimen immunophenotype, yielding a false-negative interpretation (e.g., no tumor present). Tumor populations could be missed with inadequate sample collection (biopsy or aspiration of non-malignant material), the antibody panel selection could be misdirected with insufficient clinical history, and gating strategies could be too restrictive or too inclusive to detect and isolate the tumor population adequately. Finally, quality FCI in a clinical setting should be correlated with clinical history and other laboratory analyses performed on the same patient material (e.g., morphology, cytology, histology, cytogenetics, and molecular PCR testing) to confirm the FCI results and/or to provide a more definitive overall diagnosis.
Use of normal cells found in most specimens provides an important "internal control" to further ensure quality FCI. Normal cells can be used to establish autofluorescence and fluorescence patterns for each antibody combination. These normal patterns are useful for comparison with aberrant patterns that are potentially representative of tumor populations within the same sample. Detailed guidelines for other important clinical laboratory quality control, quality assurance, and instrument performance considerations are beyond the scope of this chapter. For more information, please refer to additional referenced documents.
Preanalytic Considerations of Immunophenotyping of Hematolymphoid Neoplasia
Specimen Source
Clinical samples frequently sent for FCI of suspected hematolymphoid neoplastic involvement include blood; bone marrow; lymph node and tumor mass aspirates; pleural, acetic, synovial, ocular, or cerebrospinal fluids; bronchoalveolar lavages; and tissue from lymph node, spleen, or other organs. All specimens should be labeled with a unique patient identifier, date of collection, and specimen source. A complete patient history including any interfering medications or therapies is required to aid antibody panel selection and correlation of FCI results.
Blood and Bone Marrow
In general, patients with leukocyte counts between 3 and 10×106 / mL will require 10 mL of peripheral blood or 1–3 mL of bone marrow aspirate (see Note 1). The anticoagulant choice for blood or bone marrow is sodium heparin or EDTA (see Note 2). If transport is delayed or storage before processing is necessary, store peripheral blood in the original collection tube at 18–25°C for up to 48 h (heparin) or 24 h (EDTA). To store bone marrow, dilute with an equal volume or more of RPMI 1640 and 10% heat-inactivated FBS (caution- see Note 3) and store at 4–8°C for up to 24 h.
Fluids and Aspirates
Specimen volume for fluids and aspirates will vary by patient. In general, 0.5–5 mL for cerebrospinal fluid (CSF) and fine needle aspirates, and 10–50 mL for other bodily fluids are sufficient. Fluid and fine needle aspirate specimen sources are often paucicellular and do not require an anticoagulant. The cells of interest in these specimens can deteriorate quickly and processing time should be minimized, i.e., cell loss in CSF begins within 30 min of collection. RBC lysis should be limited to specimens with significant RBC contamination to decrease the loss of malignant cells in these paucicellular specimens. If transport is delayed or storage before processing exceeds 30 min, dilute CSF or ocular fluid with an equal volume of RPMI 1640 with 10% heat-inactivated FBS and store at 4–8°C for 18 h. Fluids other than CSF or ocular fluids, can be stored at 4–8°C for up to 18 h.
Solid Tissue Biopsies
Fresh specimens from solid tissue sources such as intact lymph nodes, tumor masses, or organ and tissue biopsies do not require anticoagulant. Generally, a 0.5–2-cm3 piece of fresh tissue is sufficient for FCI analysis. The cells may deteriorate rapidly and should be transported to the laboratory quickly in an isotonic solution such as saline or RPMI at 4–25°C. Using mechanical dissociation in an isotonic solution, a cell suspension is prepared and filtered through a 50-mm nylon mesh. Prepare a cytocentrifuge slide for morphologic review to confirm the presence of the cells of interest and begin processing immediately. Store the cells in RPMI 1640 with 10% heat-inactivated FBS at 4–8°C for up to 18 h caution- (see Note 3).
Suboptimal Specimens
Specimens should not be allowed to dry out, freeze, or come into contact with fixative for any amount of time. Specimens not meetting collection recommendations should be carefully evaluated for recollection or alternative testing. If the specimen is irreplaceable and diagnostically useful information can be obtained from the sample, FCI may be attempted with appropriate cautionary notations in the final report (see Note 4).
Analytic Considerations of Immunophenotyping of Hematolymphoid Neoplasia
Sample Preparation, RBC Lysis, and Viability Assessment
- Specimen Processing. To prevent cell loss, manipulate specimens as little as possible. To prevent labile antigen deterioration, begin processing as soon as possible (see Note 4) to determine specimen quality, viability, and the need for RBC lysis (see Note 5). In general, adjust cell concentrations to yield 0.2–2.0×10⁶ cells per tube. For minimal residual disease detection, increase the number of cells per tube to yield at least 200 tumor cells.
- Viability. In general, specimens with less than 75% viability should be recollected; efforts should be made to obtain diagnostically useful FCI from irreplaceable specimens as low viability samples consisting predominantly of neoplastic cells may yield valuable diagnostic information. Viability assessment can be determined manually using trypan blue or on the flow cytometer using fluorescent dyes (e.g., 7AAD or propidium iodide). Manual viability has the advantage of keeping all fluorescent channels available for other determinations, while the use of a fluorescent viability dye can be included in the gating strategy for nonviable versus viable analysis.
Antibody Panel Design, Staining, and Internal Control
- Antibody Panel Design. FCI of leukemia and lymphoma includes assessment of the presence, absence, and level of expression of antigens on the normal and neoplastic cells in a submitted specimen. Because most antigens lack absolute lineage specificity and neoplastic hematolymphoid cells may be missing or expressing antigens from several lineages or stages of maturation at once, a FCI panel for leukemia and lymphoma detection will include a broader range of antibodies than that required for FCI subset analysis. In addition, antibody panels should be designed with consideration for patient history, specimen source, review of morphology and other concurrent laboratory findings, and the medical indication for FCI. The panel should include enough antibodies to allow the recognition of normal and abnormal populations present in the sample while being as efficient and cost effective as possible. For example, a panel to evaluate nonspecific anemias will require a larger number of antibodies due to the broad range of potential neoplastic conditions that may cause anemia in contrast to that of a staging panel for a known non-Hodgkin B-cell lymphoma specimen. By designing sufficient antibody panels, FCI can identify the representative populations in a specimen.
Two alternative approaches based on medical indication and review of clinical history, specimen source, morphologic review, etc., are used for designing hematolymphoid neoplasia panels: (1) a single comprehensive panel of fluorescent antibodies to identify every potential differential diagnosis and (2) multiple sequential panels beginning with a primary screening panel and subsequent reflex panel(s) to narrow the differential diagnosis according to lineage. In general, using a comprehensive panel is economical in terms of processing time and provides high sensitivity and specificity for abnormal cell detection and characterization due to the broad range of antibodies employed; however, reagent costs tend to be higher and may not be offset by the savings in personnel or time compared to the second approach.
In addition to antibody selection, panel design requires an understanding of antigen expression patterns in normal and neoplastic cells as well as the efficiency of the fluorescent emission (bright vs. dim intensity) of each fluorochrome. Antigens expressed in low concentration relative to other antigens should be tested using antibodies conjugated to bright fluorochromes, while high concentration antigens can be tested using antibodies conjugated to dim fluorochromes.
The number of fluorochrome-conjugated antibodies in each staining tube will depend on several factors. These factors include the number of fluorescent detectors available on the flow cytometer, the complexity of the FCI required, the availability of appropriate antibodies, and the cellular yield in the submitted specimen (e.g., increasing the number of antibodies in each tube may reduce the total number of tubes needed for paucicellular specimens). While it may not be necessary to use the same number of antibodies in every tube, a minimum of four antibodies per tube in the majority of tubes in a leukemia or lymphoma FCI panel is strongly recommended.
An efficient panel utilizes specific antibody combinations in each tube to provide additional immunophenotypic information for each antibody beyond positive or negative. One strategy is to design a "lineage" tube to verify that all expected antigens are represented on a specific cell population (e.g., CD2/CD3/CD5/CD7 form a four-color T-cell lineage tube). Another strategy is to design a "subpopulation" tube to identify related populations. This type of tube generally includes an antibody common to all of the subpopulations being tested. Some examples include a T-cell subpopulation tube with CD3 as the common antibody and CD4 and CD8 as the subpopulation antibodies. A B-cell subpopulation tube may be designed to demonstrate light chain subpopulations (CD19 as the common antibody, kappa and lambda as the subpopulation antibodies) or maturation subpopulations (CD19 as the common antibody and CD10, CD20, and CD34 to identify maturation subpopulations). To these lineage or subpopulation tubes, additional antibodies can be added to detect tumor antigens or medical indication antigens, i.e., adding CD5 to a B-cell subpopulation tube to demonstrate clonality in a specimen with partial involvement with mantle cell lymphoma or adding CD52 for therapeutic monitoring.
Another important use of antibody combinations is to provide a common feature across all tubes for analysis gating. While FSC and SSC parameters provide two common parameters in all tubes, the use of antibodies in one or more fluorescent channels as a common "anchor" parameter allows increased FCI gating strategies. For example, a two-tube panel with no common antibodies must rely on scatter gating for panel analysis, while one common antibody in both tubes could provide multiple anchor gating strategies in addition to the original scatter gates. Lineage-specific antibodies are often used as gating anchors (e.g., CD45 for leukocytes, CD19 for B cells, and CD3 for T cells), and viability dyes can be used as gating anchors as well. Some laboratories use the common parameter idea as a negative or "dump" gating strategy. Whether it is used to select positive or negative events, keeping the common parameter fluorochrome choices the same in all of the tubes will simplify analysis. - Staining Cells. While staining for hematolymphoid FCI utilizes good laboratory practice common to other flow cytometry studies (single cell suspensions, protect antibodies from light, and follow manufacturer's recommendations), unique challenges include removal of cytophilic or residual plasma immunoglobulin (Ig), staining cytoplasmic or intranuclear antigens, and reagent validation for analyte-specific reagents (ASRs).
To meet these challenges, use the following preparation methods: Remove plasma or cytophilic immunoglobulin and avoid false-negative results (e.g. ,plasma immunoglobulin will compete with the surface B-cell antigens, leaving little or no anti-immunoglobulin reagent staining on the B cells) by prelysing or washing the specimen with an isotonic solution, i.e., phosphate-buffered saline, before antibody incubation (see Note 7). Cell permeabilization prior to staining is required for detection of cytoplasmic antigens (e.g., TdT, cytoplasmic immunoglobulin, cytoplasmic CD3, and cytoplasmic CD22). Select the optimal permeabilization reagent for the antigen being studied. When staining surface and cytoplasmic antigens in the same tube, follow the manufacturer's recommendations to ensure that surface staining is not affected by the additional fixation and permeabilization steps. Most manufacturers recommend a volume of antibody to use per number of cells to ensure maximum separation between the positive and negative populations. However, each laboratory must validate its antibody combinations for specificity and reactivity. While this is done on each specimen using internal controls, a new antibody or combination should be validated before testing patient specimens. - Internal Controls:
- Negative Internal Controls. In accordance with the US–Canadian Consensus Recommendations on the Immunophenotypic Analysis of Hematologic Neoplasia by Flow Cytometry, there is no need to run an isotype control with each specimen. The negative cell populations present within the sample serve the function of an isotype control by distinguishing aberrant fluorescent patterns from background fluorescence due to autofluorescence and nonspecific antibody binding (see Notes 3, 8, 9 and 10). For example, the normal T cells present in a specimen can serve as a negative control for anti-CD19 (a B-cell antigen). Establishing negative cell populations is especially important when analyzing myeloid leukemias due to increased fluorescence in myeloid lineages.
- Positive Internal Controls. Positive controls are required to confirm specificity and reactivity. Most of the monoclonal antibodies included in leukemia and lymphoma typing panels react with subpopulations of normal leukocytes. The staining patterns of the residual normal cells function as positive internal controls. These normal patterns can also be used to compare and contrast aberrant patterns as potentially representative of tumor populations within the same sample (see Note 10).
Data Acquisition
It is important to acquire an adequate number of events from each tube to represent normal cells (for internal positive and negative controls) and malignant cells (for disease characterization). A minimum of 10,000–50,000 total events per collection tube should be acquired as ungated listmode data. Increase acquisition events to yield at least 200 tumor cells when testing for minimal residual disease (see Note 11).
Data Analysis
Objectives and Strategies for Creating Analysis Gates
FCI analysis objectives for suspected hematolymphoid neoplasia include (1) evaluating the specimen processing quality using normal populations (internal positive and negative controls); (2) isolating the abnormal population(s) from the normal populations using one or more parameters to determine the neoplastic immunophenotype; and (3) quantifying the abnormal populations relative to the normal populations (see Note 12).
Multiple gating strategies can be utilized to define abnormal populations or to quantitate antigen expression depending on the sample characteristics and the antibody combinations used to stain the specimen. Gates are defined using parameters common to all tubes, i.e., scatter and fluorescent anchors. The following gating strategies are helpful for meeting the FCI analysis objectives.
- Light Scatter Gating. Because forward-angle light scatter (FSC) and orthogonal (90°) side light scatter (SSC) serve as gating parameters common to each tube, the FSC versus SSC gate is useful for analyzing specimens with a single homogenous population (e.g., lymph node cell suspension) as well as specimens with multiple homogeneous populations, i.e., peripheral blood. Every antibody in a panel can be analyzed with FSC versus SSC gates as long as the populations of interest are homogeneous and distinct. For example, lymphocytes with moderate FSC and low SSC can be distinct from monocytes with moderate FSC and moderate SSC. If a neoplastic population is distinct from normal lymphocytes, e.g., a large cell lymphoma with increased FSC or hairy cell leukemia (HCL) with increased SSC, no other gates may be necessary to isolate the neoplastic population.
However, most specimens contain heterogeneous populations and will require additional gating strategies to isolate the populations of interest. For example, HCL and monocytes are both moderate FSC/moderate SSC; therefore, further gating will be necessary to isolate these tumor cells in the presence of normal monocytes. - Fluorescence Gating. When two or more tubes have at least one fluorescent parameter in common, the common parameter can be used to create an anchor gate for each of the tubes. The anchor parameter is often a viability dye or a lineage antibody, i.e., 7AAD, CD45, CD3, and CD19, and it is often used with a scatter parameter or a second anchor antibody to create gates for isolating and analyzing heterogeneous populations (see Note 13).
Using Analysis Gates
Unless the clonal expansion of one tumor has resulted in total replacement of a specimen, gated analysis is often necessary to isolate the cells of interest. In general, the fewer events available or the more similar the neoplastic population is to a normal population, the more a gating strategy may be needed to isolate the population of interest. Each hematopoietic lineage can be recognized by typical staining patterns (e.g., the "checkmark" pattern for CD16 vs. CD13 in normal myeloid populations) in relationship to maturation sequence, antigen expression, and size. Events falling outside these established normal patterns can be further analyzed as potential neoplastic subpopulations.
- Ungated Analysis. Identifying a neoplastic population with a unique immunophenotype can be as simple as displaying the characteristic antibodies in an ungated dual display histogram. For example, in a bone marrow extensively involved with an acute precursor B-lymphoblastic leukemia, a large CD19-positive, CD10-positive, and CD45 dim population would be evident upon simple visual examination of the ungated data. However, small neoplastic subpopulations with immunophenotypes closer to normal can be more difficult to identify and may require gating strategies.
- Color Analysis. One analysis strategy is to view dual display histograms for each pertinent antibody combination after assigning a color to the population of interest. This can be applied after utilization of a scatter and/or fluorescence gating strategy or on ungated data. Since gating by definition limits the populations that one examines, excluding the population of interest is less likely with color gating than with sequential gating (see Notes 14). Furthermore, since only two parameters are viewed per plot, using color analysis to identify different populations increases the information obtained from each plot.
- Population Gated Analysis. Another gating strategy is to view gated dual display plots through a population gate. This strategy is effective when interfering populations make it difficult to isolate a target population. For example, myeloid cells often express higher autofluorescence than lymphocytes or blasts; therefore, excluding granulocytes with an FSC versus SSC gate will help with analysis of low SSC events such as lymphocytes and blasts.
Neoplastic populations frequently show loss of one or more lineage-specific antigens as well as coexpression of antigens not normally expressed for that lineage (see Notes 8–10). Analysis of multiple combinations of lineage and non-lineage antibodies is strongly recommended as an abbreviated analysis may not fully characterize the immunophenotype. For example, T-cell neoplasms typically show aberrant loss of CD7 expression with or without loss of other T-cell antigens, while other T-cell neoplasms may express CD7 with loss of CD3 expression. Targeting T-cell analysis for loss of CD7 alone could miss the neoplastic population altogether if CD3 was not included in the analysis.
Data Interpretation
Detection, diagnosis, and subclassification of hematolymphoid neoplasms require extensive knowledge of normal light scatter properties and antigen expression on individual hematopoietic lineages throughout the maturation sequences. Detailed guidelines for diagnostic interpretation are beyond the scope of this chapter. For more information, please refer to additional referenced documents. Malignant populations are identified based on multiple features, including aberrant antigen expression, abnormal maturation pattern, monotypic light chain expression on B cells, or restricted V-beta expression on T cells. The flow cytometry report should include a composite immunophenotype of the malignant cells, including aberrant antigen expression, estimate of the percentage of malignant cells in the sample, lineage of the tumor, stage of maturation, and expression of antigens that may be important for prognosis or therapeutic concerns. Ideally, a diagnosis is rendered based on diagnostic criteria outlined in the WHO Classification of Hematopoietic and Lymphoid Tissues and should correlate with clinical history as well as morphologic, molecular, or cytogenetic analysis (see Note 15). The general immunophenotypic characteristics of the hematolymphoid malignancies frequently encountered in clinical flow cytometry laboratories are briefly described below.
- Acute Leukemias. FCI is indicated in the diagnostic evaluation of acute leukemia. It is important to establish the lineage of the blast population (i.e., lymphoid vs. myeloid) for appropriate therapy and clinical management. Flow cytometry is sensitive and highly specific for differentiating myeloid from lymphoid lineages. Myeloid leukemias can aberrantly express lymphoid markers and lymphoid leukemias can aberrantly express myeloid markers; hence, a comprehensive panel is necessary for accurate diagnosis. After the patient has been treated with initial therapy, minimal residual disease monitoring by flow cytometry is frequently utilized to guide clinical management and therapeutic decisions.
- Acute Lymphoblastic Leukemia (ALL). ALL is a neoplasm of immature B-cell or T-cell precursors arrested in maturation. Of the cases of ALL, 75–85% are of B-cell lineage (typically positive for CD19, CD22, CD10, ±CD34, HLA-DR, and TdT with dim to negative expression of CD45) (see Note 16). The remaining percent of cases are of T-cell lineage (variable expression of CD1a, CD2, CD4, CD5, CD7, CD8, and cytoplasmic CD3) (see Note 17).
- Acute Myeloid Leukemia (AML). Flow cytometric analysis is sensitive and specific for identifying the immunophenotype and lineage specificity of AMLs in terms of granulocytic, monocytic, erythroid, or megakaryocytic differentiation. CD13 and CD33 are expressed in nearly all cases of AML. Immature AMLs are typically positive for CD117, CD34, HLA-DR, and dim CD45. Monocytic differentiation in AML is evidenced by the expression of CD14, CD4, CD11b, CD11c, CD64, CD36, CD68, and lysozyme. Glycophorin A, bright CD71, and CD36 are often expressed in acute erythroid leukemias. CD36 and the platelet glycophorins CD41, CD61, and CD42 are useful in detecting acute megakaryoblastic leukemias (see Note 18).
- Myelodysplastic and Myeloproliferative Disorders. FCI analysis is increasingly used to detect evidence of myelodysplasia, particularly in cases where the morphologic features are equivocal. Normal myeloid cells mature in a manner that is tightly controlled and regulated, generating reproducible patterns of antigen expression at different stages of maturation. Although multiple immunophenotypic abnormalities are common in myelodysplastic syndrome (MDS), there is no single MDS specific immunophenotype, and some abnormalities observed in MDS may be seen in other disorders [such as paroxysmal nocturnal hemoglobinuria (PNH), megaloblastic anemia, and post-growth factor therapy]. The patterns and combinations of multiple abnormalities distinguish MDS from other disease processes. FCI findings characteristic of MDS include abnormal intensity of antigen expression (e.g., increased or decreased levels of CD45 in granulocytes), abnormally low SSC in granulocytes (due to abnormal granularity), absence of normal antigens (e.g., CD10-negative granulocytes), non-myeloid antigens (e.g., lymphoid lineage antigens) on myeloid precursors, and aberrant maturation, such as an asynchronous pattern of maturation antigen expression (i.e., antigen patterns from different stages of differentiation co-expressed) or abnormal blast cell populations. FCI analysis also provides important prognostic information on MDS. Traditionally, FCI analysis of myeloproliferative disorders has not played a large role in diagnosis unless blast crisis or transformation to AML is clinically suspected.
- Mature B-cell Non-Hodgkin Lymphomas and Chronic Leukemias. In analysis of flow cytometric data for the presence of mature B-cell malignancies, all B cells should be examined for clusters defining cell populations with light scatter or antibody-binding characteristics that fall outside the range observed in normal B cells. Although there are several general abnormalities that are found in the evaluation of B-cell malignancies, the most useful feature of B-cell neoplasia is monotypic kappa or lambda light chain expression or light chain restriction. A B-cell population with restricted light chain expression is, with rare exceptions, considered a B-cell neoplasm (see Note 19). The absence of light chain expression is also an evidence of neoplasia(see Note 20). FCI is able to recognize monoclonal B cells in the presence of normal polyclonal B cells by the simultaneous analysis of other markers that are differentially expressed among benign and malignant cells. In addition to light chain restriction, identification of abnormal patterns of B-cell lineage antigen expression is useful in identifying malignant B cells. Most normal B cells express CD19, CD79b, CD22, and CD20, and failure to express one of these antigens is abnormal. The presence of antigens not normally found on B cells, such as T-cell or myeloid antigens, is also useful. Aberrant expression of CD2, CD4, CD7, and CD8 has been observed in B-cell chronic lymphocytic leukemia/ small lymphocytic lymphoma (B-CLL/SLL), HCL, and B-cell non-Hodgkin lymphomas. In addition to the presence or absence of specific antigens on the neoplastic cells, the expression level of various antigens, i.e., abnormally dim or bright expression, is valuable. For example, B-CLL/SLL is characterized by abnormally dim CD20 expression, while HCL is characterized by abnormally bright CD20 expression. Demonstration of these abnormally dim or bright staining populations is not only useful in detecting the presence of a malignant B-cell population but may also be instrumental in subclassifying the leukemia or lymphoma into the appropriate diagnostic category. In addition to immunophenotyping, light scatter characteristics provide important data about the cells being studied, and can be useful in detecting malignant B-cell populations. For example, abnormally high FSC can be observed in large cell lymphoma and high SSC is typically seen in hairy cell leukemia.
- Plasma Cell Neoplasms. Normal plasma cells have intense expression of CD38; are positive for CD138 and CD19; have some expression of CD45; are negative for CD56, CD117, CD20, CD22, and surface immunoglobulin; and have polyclonal cytoplasmic immunoglobulin. Malignant plasma cells are distinguished from normal cells by the absence of CD19 and CD45, aberrant expression of CD56 and CD117, diminished CD38 and/or CD138, and presence of monoclonal cytoplasmic immunoglobulin light chain.
- Mature T-cell Non-Hodgkin Lymphomas and Chronic Leukemias. Detection of T-cell neoplasia is typically based upon subset restriction; absent, diminished, or abnormally increased expression of T-cell antigens; and presence of aberrant antigens. Expansions of normally rare T-cell populations are indicators of T-cell neoplasia as well. Additionally, T-cell clonality can be directly assessed by FCI analysis of the beta chain variants of the T-cell receptor (TCR). An abnormal expansion of a Vb population is consistent with a clonal T-cell population, similar to an expansion of light chain restricted B cells in a monoclonal B-cell population. Abnormal T-cell populations can be detected using a panel of antibodies and then anti-Vb antibodies can be used to determine the clonality of the immunophenotypically defined abnormal T cells. Mature clonal T-cell populations are restricted to CD4+ CD8−, CD8+ CD4−, CD4+ CD8+, or lack of CD4− CD8− (see Notes 21 and 22). The majority of mature T-cell neoplasms fail to express at least one T-cell antigen, so it is important to include multiple T-cell antigens (CD2, CD3, CD5, and CD7) in a diagnostic panel (see Note 23). Abnormal intensity of normal T-cell antigens is the most useful method in the detection of neoplastic T-cell populations (see Note 24). Dim CD3 expression is characteristic of cutaneous T-cell lymphoma, and T-cell large granular lymphocytic leukemias typically have abnormally dim levels of CD5 expression. Some clonal T-cell processes are characterized by increased numbers of T-cell subpopulations normally present in low numbers, such as increased CD8+ T-cells coexpressing CD57, CD56, or CD16 in T-cell large granular lymphocytic (LGL) leukemia, and expanded gamma delta T cells in gamma delta T-cell lymphoma or LGL leukemia.
- Natural Killer (NK) Cell Lymphomas and Leukemias. NK cells typically express varying levels of CD2, CD7, CD8, CD16, CD56, and CD57 as well as the cytoplasmic cytotoxic proteins perforin and granzyme, but they lack surface CD3, CD5, and TCR molecules. These markers can also be expressed in T-cell neoplasms, hence it is important to demonstrate lack of CD3 and TCR. Flow cytometric analysis of NK receptor (NKR) expression, especially the killer cell immunoglobulin receptors (KIRs) and the CD94/ NKG2 complex, can provide evidence of NK cell clonality.

 Loading ......
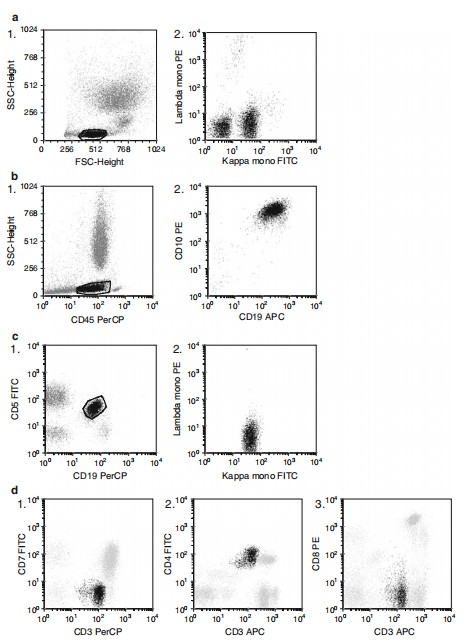 Figure 1. Flow cytometric data analysis in leukemia and lymphoma.