
Inquiry Basket
 Loading ......
For the past few decades, classic T-cell assays, such as proliferation and killer assays, have been a form of art which could be performed successfully only by highly trained personnel (and those who, in addition, were blessed with a "green thumb"), but would not work reliably for most. Moreover, those assays had the reputation of being rather irreproducible, even by such investigators. The introduction of ELISPOT, intracellular cytokine staining (ICS), and multimer analysis (e.g., tetramer and pentamer) for T-cell monitoring promised to move the field closer to attaining reliable measurements on T-cell immunity. Recently, studies have been undertaken to investigate the interlaboratory variability of these assay platforms. Identical aliquots of cryo-preserved peripheral blood mononuclear cells (PBMCs) had been sent to the participating laboratories for testing, and the results showed up to 35-, 20-, and 100-fold differences, respectively, within data obtained for ELISPOT, ICS, and tetramer. The authors of this study concluded thus: "The high degree in variability makes the comparison between any two laboratories become a game of chance."
This disturbingly high variability of T-cell assay results obtained by the multicenter initiatives might have had many reasons – certainly a major one shared by all assay platforms being data analysis. Indeed, highly discrepant results were obtained even when a single raw ICS file was sent to different experienced investigators for analysis. In this setting, all assay- or instrument-related variables were removed, the only variable being data analysis. Alerted by the high variability of the results, the international Society of Biological Treatment of cancer (iSBTc) just initiated an "ICS Gating Panel" project when this chapter was written that invites scientists experienced in ICS to develop a gating harmonization strategy.
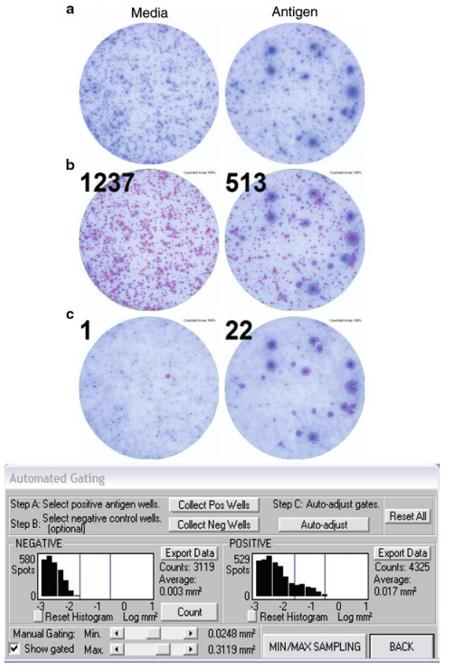 Figure 1. Statistics-based automated ELISPOT counting.
Another study published concurrently found the opposite to be the case for ELISPOT: ELISPOT data were highly reproducible among different laboratories, with the maximal variation being 0.42-fold. Notably, in this latter study, the participants were all ELISPOT novices, and the results of their first ever ELISPOT assays were obtained and reported. However, all participating laboratories followed the same protocol and the data analysis was done by a fully automated platform. Thus, for obtaining highly reproducible ELISPOT data, it is essential to eliminate subjectivity from spot counting and to replace it by fully automated, scientifically validated, and statistics-based principles for spot recognition and gating. In the following, we will outline how this is accomplished by the ImmunoSpot® Software.
One key piece of information to be gained from T-cell ELISPOT assays is the frequency of antigen-specific T cells within the entire sample cell population, as measured by the number of T cells engaged in cytokine production following antigen stimulation. This frequency reflects the clonal size of the antigen-specific T cells, and therefore, the magnitude of T cell immunity. Obviously then, one prerequisite for obtaining accurate frequency information is that both the assay and the image acquisition must be optimized for single-cell resolution.
Antigen Presentation
Each spot within an ELISPOT assay reflects on a single cell's secretory activity. In an interferon gamma (IFN-γ) ELISPOT assay, for example, IFN-G is captured by the membrane-bound anti-IFN-G antibody in the area directly surrounding the secreting cell with its size and density reflecting on the amount of cytokine produced by the cell within the assay's entire duration (see also Notes 1 and 2). Spot size and density are thus critical parameters for ELISPOT data analysis. The kinetics of cytokine production is also reflected by the spot morphology, i.e., its density and general shape. For example, a rapid secretion rate will produce a large, fuzzy spot, whereas the slow but steady release of cytokine will result in a smaller, denser spot (see Note 3). In ELISPOT assays performed with PBMC, the individual antigen-specific T cell will interact by chance with different types of antigen-presenting cells (APC). Each of these APC has different co-stimulatory property. When a T cell becomes activated by an antigen-presenting B cell, it will produce less cytokine, and will do so in a delayed fashion as compared to antigen recognition on a dendritic cell – antigen presentation by a macrophage will provide an intermediate T-cell response. For this reason, the spots seen in T-cell assays involving PBMC are invariably heterogeneous in size and density. When it comes to analyzing such results, therefore, it is not the individual spot, but rather the distributions and population kinetics of all spots within an assay that need to be examined. The ImmunoSpot® software that is designed for user-independent analysis of ELISPOT data recognizes first all spots, irrespective of size and density, and then subjects these spots to statistical evaluation to determine spot distributions.
Antigen Dose
In ELISPOT assays, the antigen dose also affects cytokine secretion rates of T cells and, hence, spots morphologies. Stimulation of a T-cell clone with a high dose of antigenic peptide induces stronger cytokine production in the individual T cells (that is, they produce larger and/or more dense spots) than does the stimulation of the same clone with low-dose peptide. When stimulated with a single antigen dose, as is frequently the case in ELISPOT assays, high-avidity T cells within the PBMC will produce larger spots than low-avidity T cells. Similarly, increased T-cell co-stimulation was shown to result in increased per-cell productivity.
Pathological Variations
In diseases such as HIV, the per-cell cytokine productivity can be significantly reduced, resulting in smaller spots. One of the many advantages of ELISPOT over other assays which measure net cytokines in supernatant (ELISA, CBA/Luminex) or mRNA is the ELISPOT assay's ability to determine whether a decreased net cytokine production is caused by a decreased number of cytokine secreting T cells or by the reduced per-cell productivity of the same number of T cells. In order to account for physiological and pathological variations in per-cell productivity, ELISPOT data analysis software must therefore be highly versatile, with the ability to recognize and analyze all variants of spots, by automatically fine tuning the counting parameters. Such fine tuning can be done manually (which will be inherently subjective), or by ImmunoSpot® software automatically, and hence in a user-independent fashion.
Assay-Related and Physiological Variations
Spot morphology varies if different antibodies are used for cytokine detections. A capture antibody with low affinity will produce fainter and more diffuse spots than a high-affinity capture antibody. Furthermore, the spot morphology will vary when different concentrations of the same antibody are used for coating. The durations of the assay can also influence spot morphology significantly. Spots grow in size and density when the assay duration is prolonged and the cells secrete continuously, as is the case for T-cell-derived IFN-γ. The outcome is different, however, when there is an early burst of production that comes to a halt before the assay is terminated. In such cases, the spot size will continue to grow even after the production of the cytokine has stopped (due to lateral cytokine diffusion caused by the reversibility of its interaction with the membrane antibodies), but spot intensity will fade due to the dilution of the cytokine. The temperature during enzymatic substrate development and the nature of the substrate will also play a role in defining the spot morphology. Red spots developed with horseradish peroxidase/amino-ethyl carbazole (HRP-AEC) differ fundamentally from the blue alkaline phosphatase-nitro-blue tetrazolium chloride/bromo-4-chloro-3c -indolyphosphate p-toluidine (ALPH-NBT/BCIP) spots, with the former being more pristine with a fainter background, while the latter more dramatic and fuzzy with a frequently more heavily stained background.
Background Variations
ELISPOT data analysis is further complicated by the fact that the spots occur over a variable background as is inherent to ELISPOT assays. While the analyte is captured around the secreting cells (resulting in the spots), some of it diffuses into the supernatant, and thereafter gets absorbed on the membrane producing a color carpet. This "ELISA effect" is more pronounced in areas of the well where densities of secreting cells are higher, many times at the edge of the well, resulting in a variable background even within a single well. Accurate ELISPOT data analysis therefore not only requires the precise recognition of various spot morphologies, but these must also be recognized over varying backgrounds over different wells or within a single well. Automatic background correction is crucial for accurate analysis of ELISPOT data and is a key feature of the ImmunoSpot® Software (see Notes 4 and 5).
Recognizing spots of different morphologies over various backgrounds is a challenge for automated ELISPOT data analysis. While counting parameters can be manually fine-tuned to accurately analyze spots on a well-to-well basis (in the same cumbersome and subjective way as it is done for flow cytometry), the SmartCount™ module of the ImmunoSpot® software performs these adjustments fully automatically for walk-away analysis. The ImmunoSpot® software recognizes first all spots, of all sizes and densities, correcting for background variations, and then subjects the spots to statistical evaluation of distributions to automatically set gates. Audit trails are produced throughout the process, with overlays of counted spots saved allowing researchers to review the accuracy of the automated process.
After the accurate recognition of spots of various size and morphologies over various backgrounds, the next challenge for ELISPOT analysis is accurate gating. As for the analysis of flow cytometry data, also for ELISPOT data analysis, it is inconceivable to meaningfully "count spots" without proper gating. As a consequence, in the media control a high number of cells are seen spontaneously producing IFN-G – these are primarily NK cells and DC. When antigen is added, the antigen-specific T cells are triggered to secrete IFN-G – because T cells produce more IFN-G on a per-cell basis than cells of the innate immune system, a new "juicier" spot category appears over the background. Thus, the spot size and morphology allows researchers to distinguish cytokine production by different cell types within mixed cell populations. In general, T cells produce substantially more cytokine on a per-cell basis, resulting in larger and denser spots than cells of the innate immune system (see Notes 6 and 7). For example, when IL-10 production by PBMC is measured in ELISPOT assays, most of the "antigen-induced" spots are not T-cell derived (as would be expected), but rather are produced by macrophages in response to bacterial lipopolysaccharide (LPS) contamination of the antigen solution. However, such macrophage-derived IL-10 spots are considerably smaller than the IL-10 spots generated by antigen-specific T cells – by gating the latter can be identified. While the LPS-induced macrophage derived spots provide no information on specific immunity, the antigen-induced T-cell-derived IL-10 spots do, since they indicate the presence of regulatory T cells. In order to measure the accurate frequency of the T-cell-derived spots, background spots need to be excluded by setting appropriate "gates." Similarly, small and faint IL-6 spots are produced by macrophages, while antigen-specific T cells produce larger and "juicier" spots that can be identified by gating. ELISPOT data analysis software must therefore be capable of distinguishing different populations of spots to determine the gates for the relevant information required for T-cell diagnostics (see Note 8). The gate settings will critically affect the number of spots counted. For this reason, one of the main goals of ELISPOT data analysis has been to establish objective criteria for gating, thereby exorcizing the "ghost of subjectivity" which has haunted ELISPOT data analysis and is haunting flow cytometer data analysis even until today.
The simplest experimental models that were used to establish ELISPOT gating criteria involved the use of T-cell clones that produced IFN-γ. These T cells were activated by the nominal peptide on a clonal population of APCs which cannot express IFN-γ. In such experiments, conducted over a wide range of T-cell frequencies, the numbers of T cells plated per well closely matched the numbers of spots detected. Even though the T cells and APC were clonal, the spot sizes varied over a wide range. Closer analysis of the spot size distributions showed that they followed a log-normal distribution. When the peptide dose was lowered, the per-cell productivity decreased, but the size distribution of spots still followed a log-normal pattern. Similarly, when the assay duration was changed, the mean spot size varied, but the log-normal distribution remained. In all subsequent studies of human and murine cells, for clonal and bulk populations, for all cytokines measured (IL-2, IL-3, IL-4, IL-5, IL-6, IL-10, and IFN-γ) and in ELISPOT assays measuring granzyme B, perforin, or TRAIL, this log-normal distribution of spots was observed. Therefore, by assessing morphologies of a multitude of individual spots, the statistical qualities of the distributions of the spots can be established, allowing the software to automatically set objective criteria for recognizing populations and set the gates, thereby identifying with a 99.7% confidence the spots formed by a specific cell population. In addition, having established these distributional properties, clusters of spots can be recognized and the numbers of spots constituting these clusters can be calculated.
One limiting factor in the accuracy of ELISPOT data analysis is the hardware used for image acquisition. There is a common misconception that the pixel resolution of the camera is the key factor in determining image quality; however, this is an overly simplistic view. A fine-grain film alone does not provide pristine photographs unless the optics, the illumination, and many other fine details are optimized. Likewise, ELISPOT readers need to be high-end optical instruments to allow for the accurate analysis of ELISPOT data at single-cell resolution. In addition, such readers must feature precise robotic motion control and image centering algorithms, so as to accurately position and capture the membrane surface. Well identity is of regulatory concern and must be verified by slip-proof, encoder-controlled stages, and by faithfully recording the accurate well positions for each well during image acquisition.
The illumination of a well will largely affect the performance of any ELISPOT analyser. An ELISPOT analyser should have a closed architecture to exclude the influence of ambient light. The light source must be optimized to provide even illumination of the well bottom without reflections caused by the wall of the well. A backlight, in addition to the top light, will allow for increased luminescence of the membrane, thus facilitating the separation of adjacent spots, and the discernment of discrete colors for dual color analysis. The light must be stabilized to permit constant performance over the operation period over a decade of use. Only industry grade illumination will provide constant readings. ImmunoSpot® Series Analyzers have been designed to meet these criteria and are equipped with a user friendly module that permits the user "at the click of a button" to verify the consistent performance of the machine.
A further challenge is harmonizing the performance of different ELISPOT analysers, as desirable for multicenter studies, and as required for the comparability of data generated in different laboratories. No two cameras capture identical images, unless the cameras are fine-tuned to the same calibration standards, along with standardizing lighting conditions and other variables, two ELISPOT readers of the same model from the same manufacturer might provide rather variable counts. Substantial effort has been invested by CTL to create fully harmonized readers that produce consistently identical results; starting with the ImmunoSpot® Series 6 analysers, these have now become available.
In the first step of ELISPOT analysis, an ImmunoSpot® Analyzer scans and saves image files of individual ELISPOT wells of a plate. The machine progresses automatically from well to well, using optical feedback to automatically center on each well, thus compensating for irregularities in the plate geometry. (ELISPOT plates are manufactured using a high-temperature molding process, and are prone to deform as they cool down.) Digital encoders keep track of the precise position of each well, thus helping to confirm well identity and positioning. In addition, the software keeps track of the encoder information, the time stamp, and the identity of the operator for tracking of such information for regulatory purposes.
The end point of the automated scanning process for an ELISPOT plate is a tamper-proof set of 96 image files, each representing a digital photograph of one well from the original 96-well plate. Scanning can also be done for 384-, 12-, 24-, and 6-well formats. The saved image files allow users to document and analyze ELISPOT assay results long after the original plates have decayed, and to reproduce the analysis results. While "live" analysis of images (i.e., without saving them to a disk file) is also possible, it is not recommended, because this obscures the transparency and reproducibility of the data, and thus violates good scientific and laboratory practice.
For work that demands high-throughput scanning, a robotic arm and stacker can be used to automatically load up to 200 plates a time. The user can instruct the ImmunoSpot® software to automatically count and process all plates instead of tediously working with each plate individually. Grouping of plates together can expedite all phases of the work: counting, quality control, and data export. The Plate Manager module permits one to flexibly group plates from different experiments and different locations for streamlined counting, quality control, viewing, printing, and exporting.
The saved image files can then be processed on the analyzer itself, or on remote workstations equipped with the ImmunoSpot® software. The dissociation of scanning and analysis enables work to proceed more efficiently by permitting an indefinite number of users to analyze images independently, without tying up the core machine.
Automated Analysis
The main steps of automated counting are as follows.
Loading Plate Images
Virtually any number of plates can be loaded at this stage, from a single folder ("Experiment"), individually, or as a group from any number of experiments, due to the flexible software design.
Defining Counting Parameters
Accurate counting requires informing the software about the nature of the spots to be counted. As discussed above, the spot characteristics can vary considerably, depending on the assay conditions and the cytokines under examination. For this reason, the ImmunoSpot® software has been designed to learn and auto-adjust the counting parameters using a simple two-stage process.
Step 1: SmartCount™ for automatic spot recognition. By clicking on wells that contain characteristic spots for a given assay, the software learns to recognize the cardinal features of the spots of interest. While establishing the appropriate counting parameters for the respective spot type which is fully automated (and therefore objective and reproducible), the parameters can be manually finetuned for spot morphology, sensitivity, and a multitude of other criteria. If such adjustments are needed, e.g., for atypical wells that contain artifacts, it is recommended to do these in the quality control step such that the objective counts and the subjective modifications are transparently documented.
Step 2: AutoGate™ for automatic gating. After the software is instructed to learn the spot morphology for accurate spot recognition, it needs to understand the distributional properties of the spots. Several wells containing typical spots need to be sampled to accumulate information for an accurate statistical analysis of the spot size distribution. Typically, this requires the sampling of 3–10 wells, a process which takes less than half a minute. At one click of a button, the software will automatically calculate and set the lower and upper gate values based on the spot's distributional properties. The AutoGate™ feature thus allows objective, statistics-based criteria to be used in setting the minimum and maximum gate for spots to be included in the count.
Spots smaller than the lower limit specified by the minimum gate are ignored; i.e., they are excluded from the final spot count. Typically, these are spots secreted by innate immune system and should not be included into the frequency of antigen-specific T cells. Spots larger than the maximum gate value are counted as cell clusters by default: the software automatically estimates the number of cells in the clusters to be included into the count.
Automated Counting
Once the parameters have been established and assigned to the wells, the software automatically counts spots on any number of plates or sections thereof. Overlays of the raw image files and of the counting results are saved for each well, as are the counting parameters. The results of the counting process thus are transparent, documented, and easily reproduced for subsequent verification in the quality control step.
Quality Control
As ELISPOT assays can be subjected to artifacts, contaminants, damaged or leaking membranes, etc., the ImmunoSpot® software was designed to permit corrections for each of the situations if needed, so that the valuable data could be remedied (see Notes 9–11). For a streamlined review, the ImmunoSpot® software allows the user to view image overlays that indicate which spots have actually been counted and to make corrections if needed. In the example shown, an artifact that resulted from the clumping of cells by free DNA in a freeze–thawed PBMC sample) has been excised. The software has calculated how many spots would occupy the excised region if the artifact was not there, assuming an even distribution of spots in the well.
To ensure Good Laboratory Practices (GLPs) compliance, all changes made in QC are recorded and annotated automatically by the ImmunoSpot® software. This allows the principal investigator or regulatory agency to determine at a glance whether the counting results have been changed relative to the automated count, and whether the changes made are accurate and appropriate. As part of this documentation, the software also automatically generates a set of plates and well image files which can be helpful in preparing presentations, publications, or discussion of the results. Direct PowerPoint Register Mark export function of the software also makes it convenient for the user to arrange groups of wells for direct comparison at desired magnifications.
ELISPOT assays are highly suited for high-throughput work. It is not uncommon for a single well-trained team to test each day hundreds of samples for reactivity to hundreds of antigens. However, even a small assay can contain a flood of information. Just three 96-well plates, for example, require storing 864 image files – raw images, counting overlays, QC images, along with the records of counting parameters, the numbers of spots counted, and the spot size/density statistics for each well. This information needs to be linked to the assay information, i.e., to the source of the cell material tested (e.g., PBMC of donor "X"), to the number of cells per well (so that frequencies can be normalized "per million"), to the antigens tested and their concentrations, and to the cytokines measured. Thus, in even a small three-plate assay, there can be more than 4,320 sets of data which need to be linked together.
The ImmunoSpot® software's SpotMap™ module was specifically designed to manage all data automatically. For each well, and for each plate, the software documents the assay conditions: which cells were plated in which numbers, which antigens were used to challenge the cells and in which concentrations, and which cytokines were measured. Custom plate layouts can be generated in a streamlined fashion for multiplate experiments – the SpotMap™ software will even calculate the amounts of reagents needed for each assay. Once the counting results are available, they can be quickly linked, within the SpotMap™ software, to the other assay parameters: at the click of a button, even the most complex ELISPOT assay can be evaluated, the statistics calculated, and the requested information represented in virtually any desired format.
Reference
Loading ......
