
Inquiry Basket
 Loading ......
The use of standard calibration beads to define the quantity of fluorophore-tagged ligands or proteins on cells or beads represents an essential element of quantitative flow cytometry that has enabled the direct comparison of inter-laboratory data as well as quality control in clinical flow cytometry. Commercial standards, such as QuantumTM FITC MESF beads, comprise a mixture of five distinct populations of beads, where the subsets are functionalized with discrete titers of fluorescein conjugates. The equivalence of fluorescence radiance of each bead population in the mix is correlated to the fluorescence of soluble fluorescein. Thus, the surface occupancy of fluorescein on the bead standards is known as the Molecules of Equivalent Soluble Fluorophores (MESF), where the MESF value is equal to the known number of molecules in solution. We have recently described a simple method of producing fluorescence calibration beads that bear discrete and defined quantities of quantum dots and demonstrated their applicability as standard calibration beads useful for multiple color calibration. The measurement model is based on a simple ratiometric formula, Eq. 1, for comparing the number of fluorophores of Samples 1 and 2. Sample 1 is an analyte capable of emitting radiation of intensity I1 that is equivalent to a single unit of Sample 2; Sample 2 is a calibration standard emitting radiation of intensity I2. For simplicity, both samples must be excited at the same wavelength and emit in the same spectral region as defined by the same bandpass filter. Equation 1 is derived from spectroscopic parameters: extinction coefficient measured at the excitation wavelength (ελ), quantum yield (ϕ), and the BP transmittance (%T) of sample emission. It enables one to determine the number density (ri) of sample fluorophores.

In Eq. 1, e can be measured from absorption spectra for most probes. The quantum yields ϕi can be determined by the end-user relative to known textbook standards.
The photophysical properties of qdots are not clearly defined like the intrinsic physical constants of molecular systems. Quantum dots are semiconductor nanoparticles with tunable optical properties that are strongly dependent on size. The spectroscopic properties of dots are dependent on their size dispersion, shape, and surface defects. Subtle differences in preparation can lead to batch-to-batch variation in basic spectroscopic properties, such as quantum yield. To the best of our knowledge, the commercial dots are not spectroscopically standardized nor are they well characterized in the product literature for them to be used "as made". In this chapter, we refer to the previous characterization of a pair of CdSe quantum dots with emission bands centered at 525 nm and 585 nm. The lot numbers are cited to emphasize the notion that the spectroscopic characteristics of these dots are strictly relevant to samples from the indicated lots. Our previous study of these samples showed an anomalous dependence of emission yield on excitation wavelength that was more pronounced in QD525 dots than in the QD585 quantum dots. This was attributed to size heterogeneity and surface defects in the QD525, consistent with characteristics previously described in the literature. It is therefore important to characterize new batches of dots before they can be used as calibration standards. Two lots of subsequently purchased QD585 dots were shown to have quantum yield values of 0.12 and 0.3, respectively.
Qdots can be photo-excited at any wavelength that can be matched to a fluorophore of choice. Therefore, calibration standards can be assembled for any fluorophore by using qdots whose emission spectra overlap with the target fluorophore. The approach is based on the display of variable and discrete site densities of streptavidin-functionalized qdots on biotin functionalized beads. Streptavidin-functionalized quantum dots are decorated by up to eight streptavidin tetrameric units per dot. It is therefore difficult to control the valency with which each dot binds to biotin-functionalized bead. The problem of unregulated multivalency has been shown to significantly limit the effort to consistently produce discrete molecular assemblies of qdots and beads at each titer of qdots. We have previously shown that an intervening layer of site directed biotin-labeled antibodies attached to beads circumvents the problem of multivalency by limiting the capture of a single dot to a single antibody in a reproducible and theoretically predictable manner. The molecular assembly on beads has been well characterized by us in terms of dissociation constants at each junction module. We have shown that titration of streptavidin-functionalized qdot to antibody bearing beads can yield discrete quantities of bound qdots in a manner consistent with the weakest equilibrium binding constant between the qdots and the antibody.
Although calibration standards, such as Quantum™ FITC MESF beads, are strictly applicable to fluorescein-based probes, it is useful to present a simple correction factor that extends their applicability to other probes operating in the same spectral range. These include most fluorescein conjugates that tend to have lower quantum yields than the parent molecule where simple derivitization of fluorescein typically attenuates the yield by at least 18% (e.g., fluorescein biotin) or greater (e.g., 80% for FITC antibody conjugates (f/p ratio 4:1)). The correction factor (cf) that is derived from Eq. 1 is shown in Eq. 2.
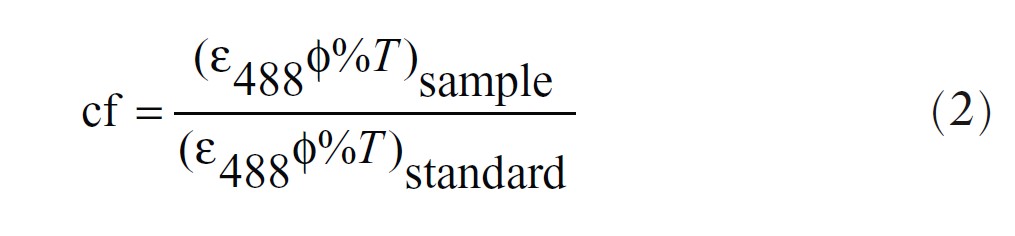
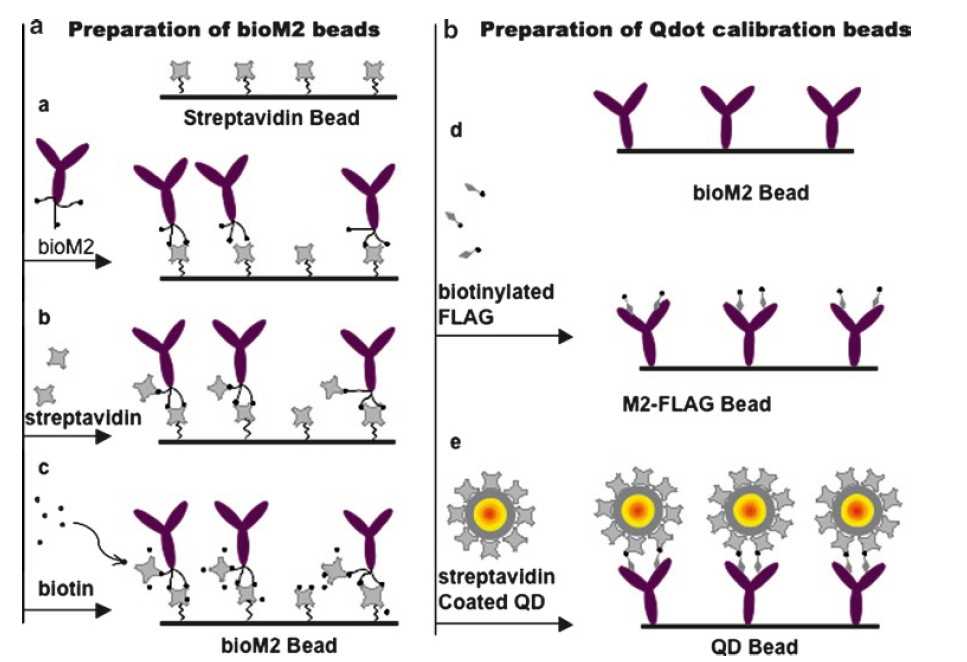 Figure 1. Summary of the molecular assembly of quantum dot fluorescence calibration beads on streptavidin-coated beads.
This protocol describes the measurement of relative emission quantum yields of quantum dots. The quantum yield of QD525 is measured relative to fluorescein, and QD585 is measured relative to rhodamine B. These dots are selected because their spectral characteristics are most suitable for analysis on a standard BD FACScan. Several factors, including size heterogeneity and potential impurities, have been shown to cause anomalous dependence of the quantum yield on the excitation wavelength when dots are excited at different wavelengths, in apparent violation of Kasha's rule: that the energy and yield of the emission should be independent of the excitation wavelength. It is therefore useful to collect a photoexcitation spectrum of any new batch of quantum dots to determine characteristic emission behavior over the putative spectral range of analysis. The protocol described in this chapter is applicable to measurements made using instruments comparable to the ones utilized here.

Use the integrated intensity of the emission spectra of sample relative to fluorescein (ϕref = 0.93) or rhodamine B (0.31 in water). Is and Iref are the integrated band intensities. The optical densities (OD) of the sample (s) and reference (ref) are taken at the excitation wavelength. n is the index of refraction of the solvent; 1.32 for water. For qdots, ϕS is accurate for the given lot number and excitation wavelength; therefore, lot number and source should always be identified.
Preparation of M2 Beads
Conceptual details can be found in the original literature. Much of the work involves the assembly of bioM2 antibodies on beads. The M2 antibodies are critical for achieving an effective monovalent binding interaction. This is an empirical finding from centrifugation assays in which it has been shown that the number of antibody-captured qdots is equal to the site density of antibodies on the same beads. Based on earlier studies, this chapter makes the following assumptions about the stock suspensions of 6.7 mm beads: (1) there are typically 40,000 beads/mL; (2) there are ≈4 million saturable bioM2 binding sites on these beads as determined from centrifugation binding assays of a fluorescently labeled FLAG peptide. Nevertheless, the reader should always verify particle counts by using a hemocytometer or particle counter.
Preparation of Quantum Dot Calibration Beads
This protocol describes the application of mass action to the preparation of beads of known surface coverage. The quantity of bound qdots can be determined from a simple mass action model as shown in Eq. 4a where Q or [Q]0, and Ab or [Ab]0 represent the initial concentrations of qdots and bioM2 sites on beads, respectively. [Q]free is unbound qdots at equilibrium. v is the volume of buffer in which beads are suspended, n is the number of beads, and A is Avogadro's number.
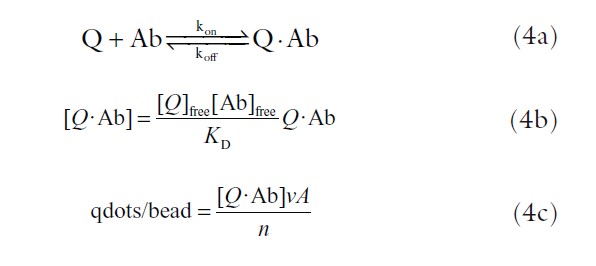
In keeping with standard practice of generating fluorescence calibration beads, it is desirable to decorate four distinct populations of beads with surface concentrations of quantum dots that span a wide range of surface occupancy. For convenience, here we describe the synthesis of a four-component set of fluorescence calibration bead populations decorated with discrete qdots surface densities ranging from 6 × 10⁴ to ≈ 2 million. Using 1 × 10⁶ bioM2 beads in 100 mL volumes yields 66.0nM Ab. Use Eq. 4b to establish the desired surface densities. The reader might find it useful to realize that, based on mass action considerations, the limiting reagent [Q]0 is depleted by Ab, and in the concentration range of interest, [Q · Ab] ≈ [Q]0. The reader can show that the error in this assumption is within 10% when [Q]0 ≤ 0.7[Ab]0.
To establish a good distribution in surface occupancy of qdots, one might consider to space [Q]0 titer intervals at half log, i.e., [Q]0 = 1, 3, 10, 30 nM to yield [Q · Ab] = 0.97, 2.9, 9.6, 28.0 nM corresponding to 5.8 × 10⁴, 1.75 × 10⁵, 5.84 × 10⁵, 8.76 × 10⁵, 1.75 × 10⁶ qdot/bead.
It is useful to demonstrate the applicability of qdot calibration beads relative to Quantum™ FITC MESF calibration beads. This is achieved through Eq. 2, which establishes a correction factor that is used to account for the differences in the measurement parameters, e, ϕ, and %T, between any given probe and the calibration standard.
Virus particles are amenable for tagging with qdots. Once labeled, the degree of labeling can be resolved by transmission electron microscopy (TEM). In this way, flow cytometry can be used to quantify bound viruses. Human papillomaviruses (HPVs) are etiological agents of a number of benign and malignant tumors of the skin and mucosa. We have recently analyzed the binding of QD585-labeled HPV particles to A431 cells by flow cytometry. QD585 calibration beads were used to measure the total number of qdots per cell ≈ 12,000 QD585 per cell, using Eq. 1. In previously unpublished data from that study, TEM was used to estimate the number of qdots per virus particle.
Reference
Loading ......
