Introduction of Flow Cytometry Protocol for Tracking Immune Cell
A multiplicity of fluorescent dyes is now commercially available for cell tracking and proliferation monitoring. Although diverse in their chemistry and fluorescence characteristics, these reagents can be categorized into two main classes based upon their mechanism of cell labeling. Dyes of one class, here referred to as “protein dyes,” permanently combine with proteins by forming a covalent bond. Dyes of the other class, here referred to as “membrane dyes,” stably intercalate within cell membranes via strong hydrophobic associations. The term “proliferation dye” will be used here to refer to dyes of either class that (a) exhibit sufficiently good chemical and metabolic stability to partition approximately equally between daughter cells at mitosis, and (b) are sufficiently nontoxic that they can be used to label cells at initial intensities that are high enough to follow the resulting dye dilution through multiple rounds of cell division. Due to their stability of cell association, cell tracking dyes of both classes have proven useful for in vivo assays of cell trafficking and recruitment in transplant and tissue repair studies and for monitoring proliferation, differentiation, and effector functions in stem and immune cell biology. In vivo cell tracking using fluorescent dyes also provides information complementary to that provided by MRI using paramagnetic or superparamagnetic particles or polymers. For example, MR-active cell tracking agents offer superior in vivo 3D imaging resolution compared with whole body fluorescence imaging, but current agents either do not allow tracking of cell division history (e.g., MR-active micro- and nanoparticles do not necessarily partition equally between daughter cells) or exhibit greater toxicity than fluorescent cell tracking dyes. Similarly, bioluminescent reporter gene imaging is ideal for very long-term tracking studies where proliferation of the labeled population may exceed the detection limit of traditional fluorescent dyes (typically seven or eight generations), because all progeny of stably transfected parental cells will contain the reporter gene. Many investigators have found it advantageous to combine genetic labeling with fluorescent cell tracking dyes in order to quantify the number of cells in each generation or assess the frequency of precursors from whence they arose, something that is not possible using genetic markers alone. Given the multitude of colors available to choose from, it seems likely that methods for combining fluorescent cell tracking dyes with bioluminescent markers will also be developed. Cell tracking using fluorescent protein and membrane dyes has also proven beneficial for in vitro studies of cytotoxic effector mechanisms, cell membrane transfer, and cell proliferation history. In vitro studies of stem/progenitor and immune cell proliferation by flow cytometry are among the most common applications of both classes of cell tracking dyes. This is true largely because of the limitations of alternate methods for proliferation monitoring. Tritiated thymidine (3H-thymidine) incorporation is reproducible and sensitive. However, it presents significant safety and regulatory issues, is ill-suited for analysis of mixed populations at the single cell level, detects only cells actively synthesizing DNA at the time of the pulse, and does not allow for the isolation of daughter cells for further analyses such as immunophenotyping, gene expression, proteomics, or functional studies. Click-i® EdU technology (available commercially from Invitrogen) detects the incorporation of a modified thymidine analog into replicating DNA under much milder conditions than labeling with bromodeoxyuridine (BrdU), can be detected using a variety of fluorochromes, and is compatible with single-cell analysis by flow cytometry. However, it also detects only cells actively synthesizing DNA at the time of the ethynyl-deoxyuridine pulse and, because detection requires mild permeabilization and fixation, is unsuitable for the isolation of viable daughter cells for functional studies. In selecting fluorescent cell tracking dye(s) for a given study, it is essential to understand the advantages and limitations of different probes in order to match the probe(s) to the needs of the application. In our experience, key considerations include (1) the ability to achieve bright initial staining intensities without altering the expression or function of cellular machinery, or otherwise affecting the functional or proliferative capabilities of labeled cells relative to unlabeled controls; (2) stability of dye–cell association sufficient to ensure that probe is not lost from labeled cells due to degradation and does not transfer to unlabeled cells over the time frame of the assay; and (3) spectral compatibility with available instrument configuration(s) and other fluorochromes to be used. Ideally, the cell-labeling protocol should also be simple, rapid, and robust (i.e., readily reproducible both intra-experimentally and intra-institutionally). In this chapter, we illustrate how these considerations are addressed in the context of two immune function assays, as well as the advantages and limitations associated with combining multiple tracking dyes to increase the information available from a given assay. In particular, we discuss protocols for a direct LAK cytotoxicity assay using PKH67 and CellVue Claret, and an in vitro suppression assay that simultaneously monitors the proliferative capacities of regulatory and effector T cells using CFSE and CellVue Claret.
Methods of Flow Cytometry Protocol for Tracking Immune Cell
Virtually any eukaryotic cell can be stained with either class of tracking dye after a single cell suspension has been obtained (see Notes 1 and 2). The labeling conditions described below have been successfully used to stain hPBMC and cultured cell targets used for the immune function assays discussed here, but are likely to require modification for other cell types, assay systems, or dye combinations (see Notes 3–5). Although CFSE is used herein to represent a typical protein-labeling dye, and PKH26, PKH67, and CellVue®Claret to represent typical membrane-labeling dyes, many other tracking dyes are available (see Note 6).
hPBMC Staining with CFSE
- Prepare a 5-mM stock solution of CFSE (MW 557.47 g/ mol) in anhydrous DMSO (see Notes 7–9).
- Wash cells to be labeled twice in serum-free PBS (or HBSS) and resuspend in serum-free buffer at a final concentration of 5 × 10⁷ cells per mL (range 0.5-50 × 106 cells/mL; see Notes 5, 10, and 11), using a tube that will hold at least six times the volume of the cell suspension.
- Immediately prior to cell labeling, prepare a 50 mM working CFSE solution by diluting the 5-mM stock solution of CFSE in DMSO from step 1 into PBS (see Note 12).
- For a final staining concentration of 5 mM CFSE, add 100 mL of working CFSE solution per mL of cell suspension (e.g., for 2 mL of cells at 5 × 10⁷ cells/mL, add 200 mL of 50 mM CFSE; see Notes 13–15).
- Immediately vortex the tube briefly to disperse CFSE throughout the cell suspension. Incubate at ambient temperature (~21°C) for 5 min, with occasional mixing either manually or on a rotator (see Notes 16 and 17).
- Stop the reaction by adding a 5× volume of CM (containing 10% FBS) or a 1× volume of FBS, and mixing well (see Note 18).
- Wash the cells twice with 5–10 volumes of CM, centrifuge at 400 × g for 5 min at ~21°C, and discard the supernatant. After resuspension of the cell pellet for the second wash, remove an aliquot for cell counting. After the final wash, adjust the cell concentration to 5 × 10⁵ cells/mL during the final resuspension in CM.
- Assess recovery, viability, and fluorescence intensity profile of labeled cells immediately post-staining to determine whether to proceed with the assay setup.
- At 24-h post-labeling, verify that labeled but non-proliferating cells (e.g., unstimulated control) are resolved well enough from unstained cells for purposes of the assay to be performed and that CFSE fluorescence can be adequately compensated in adjacent spectral windows used for measurement of other probes such as PE and RFP (see Notes 6 and 20–22). If samples are to be fixed and analyzed in batch mode, verify that loss of intensity due to fixation does not compromise the ability to distinguish desired number of daughter generations.
- Verify that labeled cells are functionally equivalent to unlabeled cells (see Note 24).
hPBMC Staining with PKH26, PKH67, or CellVue Claret ® Membrane Dyes
- Wash cells to be labeled twice in serum-free PBS or HBSS (see Note 5), using a conical polypropylene tube (see Note 25) sufficient to hold at least six times the final staining volume in step 5. After resuspension of the cell pellet for the second wash, remove an aliquot for cell counting (see Note 15) and determine the volume needed to prepare a 2× working cell solution at a concentration of 2 × 10⁶ cells per mL in step 3.
- Following the second wash in step 1, aspirate the supernatant, taking care to minimize the amount of remaining buffer (no more than 15–25 mL) while avoiding aspiration of cells from the pellet (see Notes 27 and 28). Flick the tip of the conical tube once or twice with a finger to loosen/resuspend the cell pellet in the small amount of fluid remaining, but avoid significant aeration since this reduces cell viability.
- To a second conical polyproplene tube (see Note 25), add a volume of Diluent C staining vehicle (provided with each membrane dye kit) equal to that calculated in step 1 for the preparation of the 2× cell solution. Prepare a 2× PKH26 or CellVue Claret working dye solution by adding the appropriate amount of 1 mM ethanolic dye stock to the Diluent C (e.g., add 2 mL of dye to 1.0 mL of Diluent C for a 2× working dye solution for a 2-mM working stock and a final dye concentration of 1 mM after admixture with 2× cells in step 5). Immediately triturate several times, then flick or gently vortex the tube to ensure complete dispersion of dye in the diluent, avoiding deposition of fluid in cap or as droplets on walls. Proceed with steps 4 and 5 as rapidly as possible (see Notes 29 and 30).
- Prepare a 2×cell suspension by adding the volume of Diluent C calculated in step 1 to the partially resuspended cell pellet from step 2. Triturate three to four times to obtain a singlecell suspension and proceed immediately to step 5. Excessive mixing should be avoided since this reduces cell viability.
- Rapidly admix the 2×cell suspension prepared in step 4 into the 2× working dye solution prepared in step 3, triturating three to four times immediately upon completion of addition in order to achieve as nearly instantaneous exposure of all cells to the same amount of dye as is possible (see Note 31).
- After 3 min, stop the labeling by adding a 5× volume of CM (containing 10% FBS) or a 1× volume of FBS or other cell-compatible protein, and mixing well (i.e., if 1 mL of cells was combined with 1 mL of dye, then add 10 mL of CM or 2 mL of FBS) (see Note 32).
- Centrifuge the stained cells (400 × g for 5 min at ~21°C) and then wash twice in CM. After the first wash, resuspend the cells and transfer them to a clean conical polypropylene tube (see Note 33). After the final wash, count and resuspend the cells to 1.5 × 10⁶ cells/mL in CM.
- Assess recovery, viability, and fluorescence intensity profile of labeled cells immediately post-staining to determine whether to proceed with assay setup.
- Verify that labeled but non-proliferating cells (e.g., unstimulated control) are resolved well enough from unstained cells for purposes of the assay to be performed and that membrane dye fluorescence can be adequately compensated in adjacent spectral windows used for measurement of other probes (see Notes 6, 34, and 35). 10. Verify that labeled cells are functionally equivalent to unlabeled cells (see Note 24).
Total Cytotoxicity: Quantitation of Cell-Mediated Killing Using Multiple Tracking Dyes
The radioactive chromium (51Cr)-release assay has traditionally been considered the gold standard for determining the cytolytic potential of effector cells. Although the assay is reliable, it has a number of disadvantages and functional limitations. The major disadvantage is the use of radioactivity, which is potentially hazardous and impractical for some laboratories. Other limitations include difficulty in labeling targets with 51Cr and the spontaneous release of 51Cr from targets, causing extremely high background levels, which makes resolution of effector-mediated lysis difficult. High backgrounds can be particularly problematic for longer term assays (18 h–10 days), which are sometimes required to detect low-frequency effectors or to measure antibody-dependent cytotoxicity. The use of flow cytometry and cell tracking dyes to measure cytotoxicity does not require radioactivity and has the distinct advantage of being able to measure killing at the single cell level even when targets and effectors cannot be distinguished on the basis of light scatter. In the simplest format, target cells are labeled with a tracking dye and incubated for a period of time, after which viability is assessed by flow cytometry. However, a wide variety of in vitro and in vivo cytotoxicity assays have been described, in which different combinations of tracking dyes, viability probes, and antibody reagents are used to further characterize effectors, targets, and mechanisms of killing. The protocol described here uses killing of a cultured cell line (K562) by lymphokine (IL-2) activated killer (LAK) cells as a model system, but the principles and general procedures are applicable to virtually any effector–target combination. In addition to illustrating that a new far-red cell tracking dye (CellVue Claret) does not alter LAK functionality, we discuss two different methods for measuring target cell death: (a) on a relative basis by determining percentage of targets deemed dead based on their inability to exclude 7-AAD, and (b) on an absolute basis by using counting beads to enumerate the number of viable target cells that remain when effectors are present versus when they are absent. The latter method is unaffected by cells lost due to complete lysis and, therefore, is particularly useful for longer term cytotoxicity assays.
Generation of Stained LAK Effector Cells
- Prepare hPBMC from heparinized peripheral blood using the laboratory’s standard density gradient fractionation protocol, with the addition of a final low-speed wash step (300 × g) to minimize platelet contamination (see Note 11). Count and adjust to 1 × 10⁸ hPBMC/mL.
- Stain hPBMC with CellVue Claret at a final dye concentration of 5 mM and a final cell concentration of 5 × 10⁷ cells/ mL.
- Assess recovery, viability, and fluorescence intensity profile of labeled cells immediately post-staining to determine whether to proceed with assay setup (see Note 19).
- Resuspend labeled hPBMC in CM at 3 × 10⁶ cells/mL (typically 5–10 mL total volume) and incubate upright in a T25 flask with 1,000 IU/mL of IL-2 at 37°C for 4 days to generate LAK effector cells. Set up a parallel flask of unstained hPBMC for use as assay and instrument setup controls.
- On day 4, harvest LAK effector cells, triturating to disperse any cell clusters into a single cell suspension. Wash once with 50 mL of CM, count, and resuspend at 1 × 10⁷ cells/mL in CM.
Labeling K562 Target Cells
- On day 4 of the LAK induction period, harvest logarithmically growing K562 targets (see Note 37). Wash twice with 50 mL of HBSS, count, and adjust to 2 × 10⁷ cells/mL in Diluent C for staining.
- Stain K562 cells with PKH67 at a final dye concentration of 1 mM and a final cell concentration of 1 × 10⁷cells/mL.
- Assess recovery, viability, and fluorescence intensity profile of labeled cells immediately post-staining to determine whether to proceed with assay setup (see Note 19).
- Wash PKH67-labeled K562 targets twice in 15 mL of CM. Count and adjust to 1 × 10⁵ cells/mL in CM.
Cytotoxicity Assay
- In a 96-well round-bottom plate, make triplicate serial 1:2 dilutions of the LAK effectors as follows: Pipet 200 mL of the stained LAK cell suspension into the first well, and 100 mL of CM into each of seven adjacent wells. Serially transfer 100 mL of LAK cells from the first well to the second, then from the second to the third, etc., ending with a transfer of 100 mL from the seventh well to the eighth well and removal of 100 mL of cell suspension from the eighth well.
- Add 100 mL of stained K562 targets to each well, creating effector-to-target ratios of 100:1, 50:1, 25:1, 12.5:1, 6.2:1, 3.1:1, 1.6:1, and 0.8:1 (total volume per well: 200 mL).
- Add 100 mL of targets and 100 mL of effectors to the targetonly and effector-only wells, respectively, followed by 100 mL of CM (see Note 39). Incubate the plate at 37°C for 4 h (see Note 40).
- After the incubation period has elapsed, label test wells directly in the 96-well plate with a saturating amount of anti-CD45 PacBlue on ice for 30 min (see Note 41).
- Transfer the contents of each well into individually labeled 12 × 75 mm round-bottom tubes compatible with the laboratory’s flow cytometer. Wash each well with 200 mL of cold FCM buffer and transfer the wash fluid to the appropriate tube.
- Wash each sample once with 3 mL of cold FCM buffer and resuspend in 150 mL of FCM buffer.
- Add 8 mL of 7-AAD (100 mg/mL stock) and 50 mL of Spherotech enumeration beads (stock concentration ~1 × 10⁶ beads/mL; final concentration in tube ~2.4 × 10⁵ beads/mL) using reverse pipetting technique. Let the setup stand for 30 min on ice so 7-AAD can equilibrate before initiating acquisition of flow cytometric data.
Flow Cytometric Acquisition and Analysis
- Establish appropriate voltage settings using autofluorescence and single color controls.
- Using the single color controls, adjust compensation settings according to your laboratory and/or instrument manufacturer’s standard procedures (see Note 39).
- Acquire data on the flow cytometer using the gating strategy.
- Calculate cytotoxicity using the method described in step 5 or 6.
- Method 1: Percent cytotoxicity based on 7-AAD uptake by target cells is calculated.
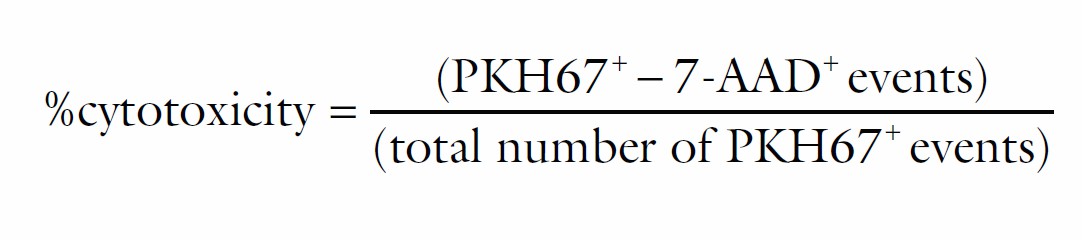

- Method 2: This alternative method uses a calculation comparable to the approach used in a standard 51Cr release assay.

Tracking Proliferation: Inhibitory and Enhancing Effects of Treg and Teff Cell Interactions
Regulatory T cells (Treg) exert potent immunosuppressive effects in autoimmune diseases, transplantation, and graft-versus-host disease, inhibiting proliferation of effector T cells (Teff) primarily by downregulating induction of their IL-2 mRNA. Phenotypically, Treg are defined by their co-expression of CD3, CD4, CD25, the transcription factor FOXP3, and dim expression of CD127, along with several other surface markers shared with activated T cells such as GITR and CTLA-4. Assays that use tracking dyes to monitor Treg suppression of anti-CD3 plus IL-2-induced effector T-cell (Teff) proliferation have significant advantages over in vitro suppression assays using 3H-thymidine, a standard measure of Treg activity. In particular, although they require approximately tenfold more cells, tracking dye-based assays reflect total Teff proliferation throughout the 4-day culture period rather than simply measuring DNA synthesis during the final hours of the response and can be extended to enable simultaneous monitoring of low level Treg proliferation as well. Our experience with a single-color in vitro suppression assay has been that it can be difficult to reliably distinguish highly proliferated CFSEdim Teff from unlabeled Treg, since both populations express similar levels of CD4. Use of a second tracking dye has the advantage of not only simplifying discrimination between Treg and CFSE dim Teff, but also allowing assessment of whether increasing numbers of Teff in the assay have any effect on Treg proliferation. In the variation described here, isolation of CD4+ Treg and Teff by sorting was combined with CFSE labeling of Teff and CellVue Claret labeling of Treg to ascertain the effect of Treg: Teff ratio on the proliferative response of each cell type (see Note 45). Parallel studies using unstained Treg confirmed that their ability to suppress Teff proliferation was unaltered by labeling with CellVue Claret.
Preparation of Monocyte-Depleted Lymphocytes (see Note 46)
- Prepare TRIMA filtrate by draining TRIMA filter into a 50-mL conical tube, followed immediately by rinsing the filter with 40 mL of 10% ACD in PBS to dislodge trapped cells.
- Isolate hPBMC from the TRIMA filtrate using the laboratory’s standard density gradient fractionation protocol, with the addition of a final low-speed wash (300 × g) to minimize platelet contamination (see Note 11).
- To separate lymphocytes from monocytes via cold aggregation, resuspend hPBMC in 50 mL of cold CM and dispense 12.5 mL each into four 15-mL conical polypropylene tubes. Affix the tubes onto the fins of tube rotator and rotate along their horizontal axis, parallel to the benchtop, at 18 rpm at 4°C to induce monocyte aggregation (see Note 47). After 30–45 min, visible 1–3 mm aggregates will form that contain primarily monocytes.
- Remove the tubes from the rotator and place vertically on ice for 15 min, permitting aggregated cells to precipitate at 1 × g to the bottom of each tube.
- Harvest supernatant containing the monocyte-depleted lymphocytes, wash twice with cold HBSS, and use for isolation of Treg, Teff, and accessory cells.
Isolation of Treg, Teff, and Accessory Cells by Flow Cytometry and Sorting
- Adjust monocyte-depleted lymphocytes, step 5, to 5 × 10⁷ cells/mL in HBSS and incubate for 10 min with 600 mg/mL of human IgG to block Fc receptor binding.
- Add a mAb cocktail containing anti-CD127 PE, anti-CD4 PECy7, and anti-CD25 APC to the IgG-blocked lymphocytes and incubate on ice for 30 min (see Note 51).
- Wash the cells twice with HBSS and resuspend at 1.5 × 10⁷ cells/mL in HBSS.
- Sort antibody-labeled cells on a fluorescence-activated cell sorter (e.g., FACSAria II or equivalent) into glass tubes containing CM at a rate that provides for purities of 95% or greater (see Note 52).
Proliferation Protocol
- Stain sorted Treg with CellVue Claret (final cell concentration of 1 × 10⁶/mL; final dye concentration, 1 mM). Wash in CM, count, and adjust to 1 × 10⁶ cells/mL.
- Stain sorted Teff cells with CFSE (final cell concentration of 5 × 10⁷/mL; final dye concentration, 5 mM). Wash in CM, count, and adjust to 5 × 10⁵ cells/mL.
- In a 96-well round-bottom plate, make triplicate serial 1:2 dilutions of the Treg as follows: Pipet 200 mL of the stained Treg suspension into the first well and 100 mL of CM into an adjacent set of four wells. Serially transfer 100 mL of Treg from the first well to the second, then from the second to the third, etc., ending with the transfer of 100 mL from the fourth well to the fifth well and removal of 100 mL of cell suspension from the fifth well (see Note 40).
- Add 100 mL of stained Teff to each well, creating Treg-to-Teff ratios of 2:1, 1:1, 0.5:1, 0.25:1, and 0.125:1 (see Note 53).
- Add 50 mL of Treg and 100 mL of Teff cell to the Treg-only and Teff-only wells, respectively (see Notes 54 and 55).
- Centrifuge sorted accessory cells (400 × g for 5 min at ~21°C), pool into a 50-mL conical tube, adjust to 1 × 10⁶ cells/mL with CM, and irradiate with 3,000 rad of gamma irradiation to inhibit proliferation. After irradiation, adjust the concentration to 5 × 10⁵ cells/mL in CM.
- To an aliquot of accessory cells commensurate with the size of the experiment, add azide-free anti-CD3 (clone OKT3) to a final concentration of 3 mg/mL and anti-CD28 (clone 28.2) to a final concentration of 1.5 mg/mL. Add 0.1 mL of this preparation to each test well from step 4, yielding a final concentration of 1 mg/mL of anti-CD3 and 0.5 mg/mL of anti- CD28 in a final volume of 0.3 mL/well.
- Add CM to bring each well to a final volume of 0.3 mL and incubate in a humidified 37°C incubator with 5% CO2 for 96 h (see Note 56).
- After the 96-h incubation, remove the plate from the incubator and harvest cells from each well into individually labeled 12 × 75 mm round-bottom tubes compatible with the laboratory’s flow cytometer and place on ice. Rinse each well with 200 mL of cold HBSS, adding with the appropriate tube. QS each tube to 3 mL with HBSS.
- Centrifuge at 400 × g for 5 min at ~21°C and resuspend each pellet in 100 mL of cold HBSS buffer, adding 10 mL of human IgG to block Fc receptor binding.
- Incubate for 10 min on ice and then label with anti-CD4 PECy7 (clone SK3) and 5 mL of LIVE/DEAD®Fixable Violet reagent, diluted 1:50 from frozen DMSO stock (see Note 57).
- Incubate for 30 min on ice and then wash two times with FCM buffer. Resuspend the cells in 300 mL of FCM buffer for flow cytometric analysis.
Flow Cytometric Acquisition and Analysis
- Establish appropriate voltage settings using autofluorescence and single-color controls.
- Using the single-color controls, adjust compensation settings according to your laboratory and/or instrument manufacturer’s standard procedures.
- Acquire data on the flow cytometer(see Note 59).
Calculation of Proliferative Fraction and Proliferative Index
Either Proliferative Fraction (%P), a semi-quantitative estimate of percent proliferating cells, or Proliferative Index (PI), a more quantitative estimate of fold population expansion, may be used to analyze the extent of proliferation. In either approach, the starting point is a single parameter tracking dye dilution profile for the appropriate subpopulation of viable lymphocytes (here CFSE for Teff and CellVue Claret for Treg), created using the gating strategy.
- Calculation of %P. To calculate %P, a stained, unstimulated control is used to set the upper boundary for enumeration of daughter cells, selecting an intensity that gives an acceptably low value for dividing cells in the absence of stimulus. An unstained control is used to define the lower boundary for the enumeration of proliferating cells, selecting an intensity that gives an acceptably low value for dividing cells in the absence of proliferation dye. %P is then defined as the percentage of proliferating cells with fluorescence intensity less than that of the stained but unstimulated control and more than that of the unstained control.
- Calculation of PI. To calculate PI, a specifically designed peakmodeling software such as ModFit LT, FCS Express, or FlowJo is used to fit the viable, lymphocyte-gated, single-parameter CFSE and CellVue Claret data. These programs use a nonlinear least squares analysis to find iteratively the best fit to the raw data by changing the position, height, and CV of each generational Gaussian. After loading and gating the histogram, users define the location of the parental generation, its spacing, and if necessary its SD. When modeling lipophilic dyes, an equal spacing between generations is assumed, whereas when modeling CFSE, an unequal spacing must be assumed to adjust for observed nonlinearities in peak spacing (possibly due to continued slow dye loss even after 24 h). The area under each Gaussian is taken as a measure of the relative number of cells in that generation and the sum of all Gaussians corresponds to the relative number of cells in the total population. These values are then used internally by the software to calculate the PI.
- Calculation of percent suppression. The degree of suppression observed when Treg cells are co-cultured with Teff cells is calculated using one of the two following methods:
Method 1:

This method is appropriate when the proliferation metric (Px) is %P or any other measure for which the value goes to 0 when the proliferative response is fully suppressed.
Method 2:
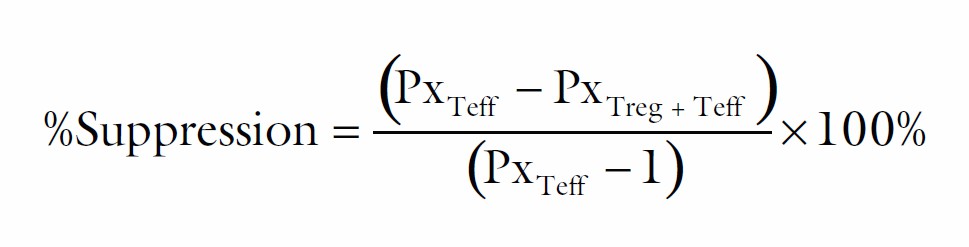
This method is appropriate when the Px is PI or any other measure for which the value goes to 1 when the proliferative response is fully suppressed.

 Loading ......
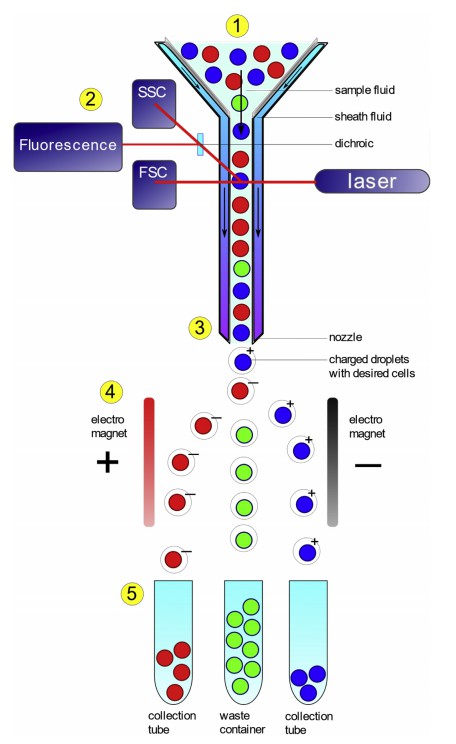 Figure 1. Cell Isolation and Cell Culture. (Bleichrodt Robert-Jan,et al.; 2019)