Introduction of Phospho-Flow Cytometry Protocol
Phospho-specific flow cytometry, or phospho flow, takes advantage of the two key traits of flow cytometry: multiparameter measurements and single-cell resolution. By measuring ten or more fluorescent parameters for each individual cell that runs through the cytometer, phospho flow enables researchers to measure multiple kinase signaling pathways in heterogeneous cell populations such as peripheral blood. This has allowed our laboratory and others to explore the normal signaling responses of the immune system in response to foreign challenges, the signaling changes that occur in disease states such as autoimmunity and cancer, and to perform high-content drug screening in both cell lines and primary cells.
Like any other method, phospho flow cytometry requires practice to perform it accurately and reproducibly. In this chapter, we progress from a simple cell line experiment to more complex experiments in blood samples. After having taught hundreds of researchers how to perform phospho flow, we have learned that the key to success is in following this progression from simple to complex, without skipping steps.
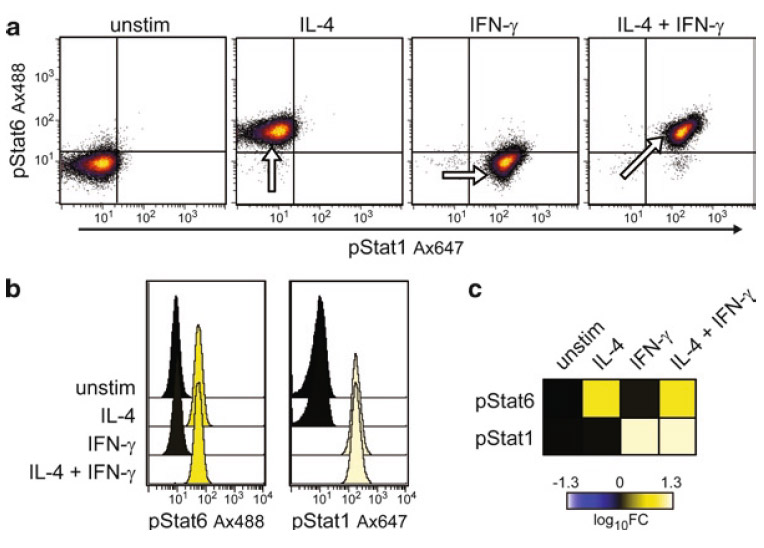 Figure 1. Sample data from U937 cell line experiment.
The largest difficulty faced by novice users is attempting to do too much in their first experiments (for instance, trying to analyze phospho-protein levels in a cell population that requires five surface markers to define and only comprises 0.3% of the total population of cells). Therefore, in our laboratory, all new researchers are taught to perform a simple phospho flow experiment using the U937 cell line. The basic steps include cell stimulation, fixation, permeabilization, and staining. The U937 cell line is easy to grow in suspension, responds robustly to stimulation, and provides consistent results. In this experiment, only phospho-proteins are analyzed, and compensation is not required on the flow cytometer. This simplifies the experiment and allows the researcher to focus on performing the phospho flow method rather than setting up the cytometer. Once mastered, the U937 cell line experiment gives the researcher confidence that they can measure intracellular signaling events by flow cytometry, and provides the basis for performing more advanced experiments in primary samples.
In the subsequent sections, we add levels of complexity to the simple cell line experiment. In the PBMC experiment, surface markers are analyzed in addition to the intracellular proteins. In this way, cell types of interest (such as T cells, B cells, and monocytes) can be identified and analyzed biochemically. It is important to note that the choice of surface marker antibodies, as well as the titration and validation for use in this platform, must be considered carefully. In the whole blood experiment, signaling is measured directly in whole blood without first purifying the mononuclear cells by Ficoll separation. This enables measurements in the most physiologically relevant context, and is particularly appealing for pharmacodynamic monitoring of drugs directly in patient samples, or for diagnostic stratification of disease states.
We then present a slightly modified method, which we term "sequential staining," whereby surface markers that are difficult to analyze after permeabilization are stained prior to cell permeabilization. Although useful for staining surface antigens, this method has limitations as to the fluorophores that can be used.
Finally, we present a basic outline of how to analyze the data obtained with phospho flow. Unlike traditional flow cytometry, which typically compares percentages of cells in a particular gate, phospho flow is a quantitative method that compares the fluorescence intensity of a population before and after stimulation with a cytokine or other molecule. Here, we provide simple equations and ways to visualize the data, which can quickly become overwhelming in the light of the number of cell types and phospho-proteins that can be analyzed simultaneously in one sample.
Methods of Phospho-Flow Cytometry Protocol
The phospho flow method can be broken down into the following six steps:
- Stimulation
Cells of interest, which can be a cell line, or primary cells from a mouse or human, are treated with various molecules that might affect cell signaling such as cytokines, small molecule drugs, or growth factors. Cells can also be obtained directly from patients and tested without further treatment to examine "basal" signaling, but we have found that probing the cells with stimuli better reveals signaling changes in disease states. - Fixation
Cells are fixed with formaldehyde in order to stop signaling and phosphorylation events as rapidly as possible. Formaldehyde is a cross-linking agent that enters the cell and reacts with amine groups on proteins. This binding can lead to protein–protein cross-linking but more importantly arrests enzymatic activity and halts cellular metabolism. Some signaling events, particularly on proteins that are proximal to the cell membrane such as Syk, ZAP70, and PLCg, can decay within 15 min of induction. Therefore, cells must be fixed without washing, in order to preserve the most accurate representation of the phosphorylation state. - Permeabilization
Cells are permeabilized with methanol so that antibodies against intracellular proteins can enter the cells and stain their target antigens. Although different permeabilization reagents are available, methanol, or other similar denaturing agents, is required for staining the Signal Transducer and Activator of Transcription (Stat) proteins which are critical to nearly all cytokine-mediated signaling pathways. In addition, we have found methanol to be the most universal reagent, working for the largest number of phospho-specific antibodies. - Staining
Cells are stained with antibodies specific to the phosphorylated form of intracellular signaling proteins. These antibodies do not bind to the non-phosphorylated form, and therefore, the amount of antibody binding to a cell directly correlates to the amount of phosphorylation on the target protein. Primary blood samples must also be stained with antibodies against surface antigens to identify cell types of interest. These surface antibodies must be carefully validated for use in permeabilized cells, as many show greatly increased background staining when exposed to the massive number of protein and nucleic acid epitopes that are present inside the cell, but not on the cell surface. If necessary, cells can be surface stained after fixation, but prior to permeabilization, in a method called sequential staining, outlined below. - Acquisition
Cells are acquired on a flow cytometer, and the fluorescence intensity of each antibody binding to each cell is measured. - Analysis
Phospho flow data analysis requires quantitative comparisons between samples to determine the amount of protein phosphorylation induced after stimulation, or in a particular disease state. This differs from typical surface phenotyping experiments done with flow cytometry, where the percentage of positive cells is the main metric. Therefore, in phospho flow analysis, the fluorescence intensity of the phospho-antibody staining is compared to a control, and a "fold change" value is calculated. Data sets produced with phospho flow can become extremely large due to the multiparametric nature of the experiments. For instance, a typical experiment might measure five stimulation conditions in five cell populations, across five different signaling proteins. This experiment, which might only require about ten samples to be run on the cytometer, would yield 125 data points. Therefore, we often display data in heatmap format, as a tool to summarize the data for overall visualization. It is important to remember that each point in a heatmap is representative of thousands of individual cells, requiring the researcher to examine samples with interesting signaling phenotypes more closely.
U937 Cell Line
The U937 cell line experiment is the simplest phospho flow experiment that all new users should perform. In this experiment, cells are stimulated with two cytokines, IFN-γ and IL-4. The cells are then fixed with formaldehyde, permeabilized with methanol, washed, and stained with phospho-specific antibodies. Because the cell line is extremely consistent in its response profile, users can optimize their technique by repeating the experiment until the expected pattern of phosphorylation is observed, and the shifts in phospho-protein levels are adequate.
- Grow U937 cell line to ~0.5 to 1 × 10⁶ cells/mL in RPMI-10 (5 mL is required for this experiment).
- Quickly place 1 mL of cells in five FACS tubes, numbered 1–5 (see Note 1).
- Quickly add the cytokines IFN-γ and IL-4 at 10 ng/mL final concentration, in the order listed below (see Notes 2 and 3).
| Tube1 | 2 | 3 | 4 | 5 |
| None | None | IFN-g | IL-4 | IFN-γ+ IL-4 |
- Incubate the cells for 15 min at 37°C in a 5% CO2 incubator.
- Quickly add 100 mL of 16% formaldehyde (final concentration of ~1.5%) (see Note 4).
- Keep the tubes at room temperature for 10 min.
- Centrifuge the samples (500 × g, 4°C, 5 min).
- Decant the supernatant by inverting and flicking the tubes, leaving the pellet of cells at the bottom.
- Resuspend the cell pellet in the residual medium (normally 30–70 mL) by vortexing briefly for 3–5 s or shaking the tubes vigorously by hand.
- Add 1 mL of ice cold methanol to the resuspended cells.
- Vortex the cells for 3–5 s.
- Place the tubes on ice for 15–30 min (see Note 5). 1
- 3. Add 3 mL of staining medium on top of the methanol.
- Repeat steps 7–9.
- Add 4 mL of staining medium to the cell pellet.
- Repeat steps 7–9.
- Add 80 mL of staining medium to the pellet. With the residual volume typically left after decanting the supernatant, each tube should have 110–150 mL of suspension at this point.
- Transfer 80 mL of the cell suspension into a fresh set of five FACS tubes, numbered A1–5 (see Note 6).
- Stain the cells by adding 20 mL each of pStat1 Ax647 and pStat6 Ax488 phospho-specific antibodies to tubes A2–5, and add 40 mL of staining medium to tube A1 as a control. The total volume will be 120 mL. Tube A1 serves as an unstained control useful for instrument setup and comparison of phospho-protein staining intensities.
- Vortex to mix.
- Stain for 30 min to 1 h at room temperature (see Note 7).
- Add 3 mL of staining medium.
- Repeat steps 7–9.
- Add 100 mL of staining medium. Keep the samples cold until acquisition (see Note 8).
- Run the samples on a flow cytometer. Use the unstained control to set the instrument PMTs for Ax488 (FL1 with 530/30 bandpass filter on FACSCalibur) and Ax647 (FL4 with 661/16 bandpass filter) so that the cells appear in the lower quadrant of each parameter. Because Ax488 and Ax647 are spectrally distinct and are excited by the 488- and 633-nm lasers, respectively, compensation is not required.
- Acquire 10,000 events for each sample. IFN-γ induces pStat1, while IL-4 induces pStat6. The combination stimulation should induce both phospho-proteins.
Primary Human PBMC
Experiments in primary cells are more complex than the U937 cell line experiment in that surface markers must also be used to identify cell types within the heterogeneous PBMC sample. It is absolutely critical to validate the surface marker antibodies for use in permeabilized cells. Many antibodies that work well in live cell staining do not separate the appropriate cell populations once the cells have been fixed and permeabilized. In addition, primary samples first require isolation, freezing, and thawing of the PBMCs, all of which can affect signaling responses. The method outlined below is used routinely in our laboratory for clinical samples.
Preparation and Freezing of PBMCs
Note: If PBMCs are to be prepared immediately before the experiment.
- Prepare PBMCs from whole blood by Ficoll purification.
- Resuspend the cells at approximately ten million cells per mL in ice-cold FBS containing 10% DMSO (the freezing medium).
- Aliquot 1 mL of cells per cryovial.
- Freeze slowly (1°C/min) in −80°C freezer (see Note 9).
- Transfer to liquid nitrogen the next day for long-term storage.
Phospho Flow in PBMCs
- Remove a vial of frozen PBMCs from liquid nitrogen.
- Thaw quickly (1 min) in 37°C water bath.
- Pipette the cells into 25 mL of RPMI-10 at room temperature in a 50-mL conical tube.
- Centrifuge the samples (500 × g, room temperature, 5 min).
- Aspirate or decant the supernatant into 10% bleach solution (see Note 10).
- Tap the tube onto the benchtop to dislodge the cell pellet.
- Add 25 mL of RPMI-10 and pipette up and down to break any cell clumps (see Note 11).
- Repeat steps 4–6.
- Add 5 mL of RPMI-10 and pipette up and down to break any cell clumps. The cell concentration should be at ~2 × 10⁶/mL at this point.
- Place the cells in 37°C 5% CO2 incubator for 1 h (see Note 12).
- (Perform steps 11 and 12 as quickly as possible to avoid cooling the cells.) Place 1 mL of cells into five FACS tubes labeled 1–5.
- Add the following stimuli.
| Tube1 | 2 | 3 | 4 | 5 |
| None | None IL-6 | IL-6 (50 ng/mL) | IL-10 (50 ng/mL) | LPS (1 mg/mL) |
- Incubate the cells for 15 min at 37°C in a 5% CO2 incubator.
- Quickly add 100 mL of 16% formaldehyde (final concentration of ~1.5%).
- Keep the tubes at room temperature for 10 min.
- Centrifuge the samples (500 × g, 4°C, 5 min).
- Decant the supernatant by inverting and flicking the tubes, leaving the pellet of cells at the bottom.
- Resuspend the cell pellet in the residual medium (normally 30–70 mL) by vortexing for a few seconds or shaking the tubes vigorously by hand.
- Add 1 mL of ice-cold methanol to the pellet.
- Vortex the cells for 3–5 s to suspend them in the methanol.
- Place the tubes on ice for 15–30 min (see Note 5).
- Add 3 mL of staining medium on top of the methanol.
- Repeat steps 16–18.
- Add 4 mL of staining medium to the cell pellet.
- Repeat steps 16–18.
- Add 50 mL of staining medium to the pellet. With the residual volume typically left after decanting the supernatant, each tube should have 80–120 mL of the suspension at this point.
- Transfer 50 mL of the cell suspension into a fresh set of five FACS tubes, numbered A1–5 (see Note 6).
- Create the antibody cocktail below and add 80 mL to tubes A2–5 (total volume will be 130 mL). Add 80 mL of staining medium to tube A1. Antibody cocktail should be made such that there is enough for at least one extra sample, to ensure having enough for all samples and accommodating small pipetting errors. Here, antibody cocktail is prepared for five samples, although only four are stained.
- Vortex to mix.
- Stain for 1 h at room temperature (see Note 7).
- Add 3 mL of staining medium.
- Repeat steps 16–18.
- Add 100 mL of staining medium. Keep the samples cold until acquisition (see Note 8).
- Prepare proper compensation controls for each fluorophore being used in the experiment.
- Acquire compensation controls and samples on a flow cytometer. Acquire at least 50,000 events per sample. IL-6 and IL-10 induce Stat3 phosphorylation in many cell types, while LPS induces p38 phosphorylation in monocytes only.
Primary Human Whole Blood
Experiments in whole blood enable measurements to be made in the most physiologically relevant environment for human samples. Unlike Ficoll-purified PBMC samples, whole blood contains neutrophils and granulocytes (creating a much different forward vs. side scatter plot), red blood cells, and all of the protein factors present in the serum. This provides a more "normal" context for cell signaling to occur. However, the presence of the massive number of red blood cells complicates flow cytometry and requires that the cells be lysed prior to analysis.
In this method, the red blood cells are lysed simultaneously as the white blood cells are fixed, using a Lyse/Fix buffer. This extra step allows stimulation to occur in the whole blood and enables rapid termination of the stimulation reaction at the desired time point. Once the red blood cells are lysed, the samples are treated just as PBMC samples or the U937 cell line. Note: Prior to starting the experiment, prepare 1× Lyse/Fix buffer by diluting 5× buffer with purified water and warming to 37°C in a water bath.
- Obtain human whole blood drawn into heparin tube (typically green top) (see Note 13).
- Place in 37°C water bath for 30 min to ensure blood is warm for stimulation (see Note 14).
- Aliquot 200 mL of blood into five FACS tubes, labeled 1–5 (see Note 1).
- Add stimuli as follows:
| Tube1 | 2 | 3 | 4 | 5 |
| None | None | IL-6 (50 ng/mL) | IL-10 (50 ng/mL) | LPS (1 mg/mL) |
- Incubate for 15 min at 37°C.
- Add 4 mL of 1× Lyse/Fix buffer (prewarmed to 37°C).
- Mix thoroughly by inverting the tube with cap ten times or by pipetting up and down ten times (see Note 15).
- Incubate for 15 min at 37°C in a waterbath or incubator.
- Centrifuge the samples (500 × g, 4°C, 5 min).
- Aspirate or decant the supernatant.
- Vortex the cells for 3–5 s to dislodge the cell pellet in the residual volume.
- Add 4 mL of ice-cold PBS (see Note 16).
- Repeat steps 9–11.
- Add 1 mL of ice-cold methanol.
- Place the samples on ice for 15–30 min (see Note 5).
- Add 3 mL of staining medium on top of the methanol.
- Repeat steps 9–11.
- Add 4 mL of staining medium to the cell pellet.
- Repeat steps 9–11.
- Add 50 mL of staining medium to the pellet. With the residual volume typically left after decanting the supernatant, each tube should have 80–120 mL of cell suspension at this point.
- Transfer 50 mL of the cell suspension into a fresh set of five FACS tubes, numbered A1–5 (see Note 6).
- Create the antibody cocktail below and add 80 mL to tubes A2–5 (total volume will be 130 mL). Add 80 mL of staining medium to tube A1. Sample A1 serves as an unstained control for cytometer setup. Antibody cocktail should be made so as to have enough for at least one extra sample, to ensure having enough for all samples and accommodating small pipetting errors (in this case, enough cocktail should be prepared for five samples).
- Incubate for 1 h at room temperature.
- Add 4 mL of staining medium to the cells.
- Repeat steps 9–11.
- Add 100 mL of staining medium to the cells.
- Acquire 100–200,000 events per sample on the flow cytometer. The results are nearly identical to the PBMC experiment. However, the presence of neutrophils and granulocytes adds many large cells to the forward versus side scatter plots, and makes gating of the monocytes slightly more difficult. Monocytes are high for CD33 expression, while neutrophils and granulocytes are intermediate (with the suggested clone of CD33 antibody). Monocytes have a much more robust response to LPS, so accurate gating is important for observing maximal induction.
Surface Marker Antibody Validation and Sequential Staining
Perhaps the most important, and most difficult, part of phospho flow is the proper identification of cellular subsets (e.g. T cells, B cells, and monocytes), within heterogeneous samples such as peripheral blood. This is accomplished by staining antigens (e.g. CD3, CD20, and CD33) present on the cell surface of each cell subset. Surface staining can be performed at several points in the phospho flow protocol, each with its advantages and disadvantages.
In our laboratory, most "surface" staining is performed on fixed/permeabilized cells with antibodies that have been carefully validated for use in this protocol. This enables us to stain all markers, both intracellular and surface, simultaneously, greatly simplifying the protocol. This is also the most flexible way to stain samples, because they can be stored in methanol for months at a time, and then stained with different antibody cocktails as the research project develops and new hypotheses need to be tested.
However, some antibodies do not work when staining fixed/ permeabilized cells. In these cases, the background staining may increase dramatically, or positive staining may decrease. In either case, one can no longer resolve the positive population. To solve this problem, we adopt a "sequential staining" approach, where stimulated cells are fixed, stained for these difficult surface antigens, then permeabilized, and stained for intracellular epitopes. Note, however, that fluorophore choices are limited in the sequential staining protocol. Protein fluorophores such as PE, PerCP, and APC are denatured by methanol and lose their fluorescence if used in sequential methods. Therefore, antibodies must be conjugated to small molecule fluorophores such as FITC, the Alexa dyes, and DyLight dyes, or to Quantum dots, for use in the sequential methods.
With proper testing and validation, nearly all surface antigens can be stained effectively in the phospho flow protocol.
Surface Marker Validation for Use After Methanol
- Prepare or thaw 10 × 106 PBMCs.
- Resuspend at 2 × 10⁶ cells/mL in prewarmed, 37°C RPMI-10.
- Place 2.5 mL (5 × 10⁶) of cells into two FACS tubes.
- Tube 1 (live cells): Place on ice. Proceed to step 6.
- Tube 2 (fixed/permeabilized cells), steps 5–12.
- Add 250 mL of 16% formaldehyde.
- Incubate for 10 min at room temperature.
- Pellet the cells by centrifugation (500 × g, 4°C, 5 min).
- Decant or aspirate the supernatant.
- Vortex 3–5 s to resuspend the cells in residual volume.
- Add 1 mL of ice-cold methanol.
- Incubate on ice for 15–30 min.
- Add 2–3 mL of staining medium.
- Centrifuge the samples (500 × g, 4°C, 5 min).
- Decant the supernatant by inverting and flicking the tubes, leaving the pellet of cells at the bottom.
- Resuspend the cell pellet in the residual medium (normally 30–70 mL) by vortexing for 3–5 s or shaking the tubes vigorously by hand.
- Add 4 mL of staining medium.
- Repeat steps 7–9.
- Resuspend the cells by adding 500 mL of staining medium to each tube.
- Aliquot 100 mL of cells into five tubes each for live and fixed/ permeabilized cells.
- Add varying amounts of the surface marker antibody being tested. Titrate from high to low concentration. Begin with ~1 mg/mL of antibody, or at the manufacturer's recommended dilution. Threefold dilutions work well, and cover a large enough range to obtain a good titer for most antibodies (most monoclonal antibodies have optimal titers between 10 ng/mL and 1 mg/mL).
- Analyze on the flow cytometer.
- Compare staining in live cells versus fixed/permeabilized cells. For proper validation, antibody must show (see Note 17):
- Same percentage of cells in both cases.
- Adequate resolution, or separation, of positive cells from negative populations.
- If antibody does not stain proper percentage of cells, or lacks resolution/separation, sequential staining may be preferred.
Sequential Staining
- Prepare and stimulate cells.
- Fix cells with 100 mL of 16% formaldehyde per 1 mL of cells (1.5% final concentration).
- Centrifuge the samples (500 × g, 4°C, 5 min).
- Decant the supernatant by inverting and flicking the tubes.
- Resuspend the cell pellet in the residual medium.
- Wash the cells by adding 4 mL of staining medium.
- Centrifuge the samples (500 × g, 4°C, 5 min).
- Resuspend the cells at ~1 × 10⁶ cells/100 mL in staining medium.
- Transfer 100 mL of cells into fresh tubes.
- Stain with the appropriate dilution of surface marker antibodies (typically the same amount as that used for live cell staining). Important note: antibodies must be conjugated to small molecule fluorescent dyes or quantum dots for sequential staining. Antibodies conjugated to protein fluorophores such as PE, PerCP, and APC will lose fluorescence when treated with methanol (see Note 18).
- Incubate for 30 min on ice.
- Wash the cells by adding 3 mL of staining medium.
- Centrifuge the samples (500 × g, 4°C, 5 min).
- Decant the supernatant by inverting and flicking the tubes.
- Resuspend the cell pellet in the residual medium.
- Add 1 mL of ice-cold methanol per mL of starting cell volume.
- Incubate for 15–30 min on ice.
- Repeat steps 12–15 twice to wash methanol from cells.
- Resuspend the cells at ~1 × 10⁶ cells/100 mL in staining medium.
- Transfer to fresh FACS tube.
- Stain the samples with phospho-specific antibodies and any surface marker antibodies conjugated to PE, PerCP, or APC (and their tandems), which have been validated for use in fixed/permeabilized cells.
- Incubate for 1 h at room temperature.
- Wash the cells and analyze on flow cytometer as above.
Data Analysis in Phospho Flow
Phospho flow data analysis is somewhat different than typical flow cytometry experiments, because different samples must be compared quantitatively to a control sample. In phospho flow, one wants to measure the amount of phosphorylation induced by treating a sample with a particular cytokine, or the change in phosphorylation associated with a diseased sample versus that in a normal sample.
Different cell populations within the sample are first gated based on their surface marker staining. The median fluorescence intensity is then calculated for the phospho-specific antibody channel for each population. Medians, as opposed to means, are utilized to avoid the effects of outliers. However, it is important to be cognizant of your data. Medians may not be appropriate for a bimodal distribution, for instance. Comparisons are made within cell types under different conditions, e.g. stimulated versus unstimulated B cells. However, it is difficult to compare between different cell types, e.g. B cells versus monocytes, due to differences in background binding of phosphospecific antibodies, as well as autofluorescence differences due to cell size/shape.
Our laboratory has developed web-based software, called Cytobank, for storing, sharing, analyzing, and visualizing flow cytometry data sets. In particular, Cytobank is well-suited to analyze phospho flow data with its ability to create heatmaps and histogram overlays without requiring third party software. In fact, the steps outlined below can all be performed automatically within Cytobank, eliminating the need for spreadsheet programs. All figures in this chapter were generated using Cytobank.
- During or after acquiring data on the flow cytometer, compensate data with appropriate compensation controls.
- Draw gates around cell populations of interest. A standard gating method is to first gate on intact cells based on their forward and side scatter characteristics.
- Then, use the other fluorescent parameters to identify cell types of interest. For instance, CD3+ cells are T cells, CD20+ cells are B cells, and CD33+ cells are monocytes.
- For each population that has been gated, calculate the median fluorescence intensity (MFI) of the phospho-protein channel (typically Alexa 488 or Alexa 647).
- Apply this gating and statistic to all the samples that were acquired.
- Export or copy/paste the MFI values for each population into a spreadsheet program.
- Calculate the fold change in phosphorylation induced by each particular stimulation or treatment (e.g. cytokine) with the following equation:

- This equation simply compares the MFI value of the stimulated samples to the MFI value of the control/unstimulated sample.
- If there is no change in phosphorylation upon stimulation, then fold change = 1.
- If the phospho-specific antibody staining intensity doubles upon stimulation, then fold change = 2.
- For visualizing the data (and to accommodate negative changes), it is useful to represent no change in phosphorylation as zero. Therefore, we often calculate the log2 or log10 fold change:

- Here, if no change in phosphorylation is observed upon treatment, log2FC = 0.
- If the staining intensity doubles, log2FC = 1.
- If the staining intensity is halved, log2FC = −1.
- The log2FC values can now be exported to heatmap analysis software, often used for DNA microarray analysis. A positive change is often represented as yellow, and a negative change as cyan. No change is represented as black. This allows rapid visual identification of stimulations or conditions that lead to a change in phosphorylation levels. However, since only the median is utilized, it is critical to examine the responding samples to determine whether all of the cells in a population responded (unimodal), or if only a fraction responded (bimodal or multimodal peaks). Multimodal peaks typically indicate that a particular population contains sub-populations of cells that need to be identified with more surface markers.
As mentioned above, Cytobank, a software suite developed in our laboratory, is able to perform all of these calculations for the user. In addition, Cytobank enables visualization of the data in heatmap and histogram overlay format.

 Loading ......
