
Inquiry Basket
 Loading ......
Accuracy of spot detection and quantification is of critical importance for the analysis of ELISPOT data. However, spots have different staining intensities and vary in morphology which makes it challenging for software developers to design a software application.
It is well-known that identical objects can look dramatically different depending on illumination conditions and optical characteristics of illuminated objects. This hinders the analysis and interpretation of the objects in the field of view when image processing must be independent of its registration conditions. For solving such problems, morphological image analysis methods were designed and they proved their efficiency.
Mathematical notion of the form comprises the foundation of such methods. The form (e.g., profile or shape of the spot) is the maximum invariant of image transformations that take place under various registration conditions using different cameras and so on. That is why the form is defined not only by the analyzed object and the scene it is on, but is also connected with the model of scene (or object) registration being the fundamental part of morphological analysis.
In some practical cases, the profiles of objects are predefined. For example, the spots in ELISPOT assay (including dual-color ELISPOT assays) are either round or have a concentric profile. This makes it possible to successfully solve a variety of application problems related to detecting and classifying such objects.
Standard IBM-PC compatible personal computer was used running under Microsoft Windows XP operating system. Microsoft C++ Compiler 6.0, standard edition, was used to compile the software described.
From this set to choose the image having the best approximation of image g, we need to solve the following extreme problem:

where Pf operator is the orthogonal projector on the linear image space with forms not more complicated than the form of image f:

Here, Xi(x, y) is the indicating function of i-field of image f which equals to 1 in inner i-field dots and equals to 0 in other dots, Ci – the brightness of i-field of the chosen image.
So, Pfg is the best approximation for image g by images with forms not more complicated than the form of image f. Consequently, the image f Pg g represents all distinctions between image f and image g on the basis of the form and is called the "image of residual." And functional f Pg g could be used as the measure of difference between image g and image f on the basis of the form. However, this algorithm for low-contrast images is error-prone because any low-contrast image is similar to any other image (brightness levels Ci coincides). That is why the measure of the similarity by form is defined as the following ratio:

where P0 is the projector of image g on constant image:

(indicating function Xx is equal to 1 in the whole view angle X).
Let us state the obvious features of the functional Eq. 3. The less the value of the functional, tfg the more the similarity between the image g and the image f and the farther it is from constant. In real situations, if the image g is close to constant, then the denominator of the fraction is fairly small and is comparable to the nominator of the fraction. And if the image g is not more complicated than the image f by form and is not a constant, then the fraction equals 0. And, at last, if the image g is not similar to image f by form and differs from the constant, then the numerator and denominator of the fraction are approximately equal to each other.
According to this theory, the problem of searching for objects can be formulated as follows:
There are situations when detecting the correct color of the spot is important for accurate diagnostics: in dual-color ELISPOT assays, the color of the spot not only provides means for recognizing spots, but also serves as a marker of the type of a secreted cytokine. The problem of color classification is well-known and can be solved by cluster analysis which subdivides sets of objects by associating them with some classes on the basis of the mathematical criterion of classification quality. This criterion must reflect somehow the following nonformal demands:
The central point in cluster analysis is the choice of metrics (measure of proximity of objects to each other). The choice of metrics greatly influences the ultimate result of subdivision of objects into groups according to a given algorithm of the dividing process. This choice is closely correlated with main goals of the research in whole, with physical and statistical nature of utilized information, etc.
Another important feature of cluster analysis is the measure of proximity between groups of objects (see Note 1). Let us go over the most popular proximity measures characterizing mutual disposition of groups of objects.
Let wi – ith group of objects, N – the number of objects in the group wi, vector μi – arithmetic mean of objects in wi, and q (wn, wm) – the distance between groups wn and wm.
The nearest neighbor distance is the distance between the closest objects of the clusters:

The farthest neighbor distance is the distance between the farthest objects of the clusters:

The centroid distance is the distance between the central points of the clusters:

The choice of the measure of the distance between the clusters basically affects the outline of the geometrical groups of objects generated by algorithms of cluster analysis in the feature space. Those algorithms based on the nearest neighbor distance are adequate in a specific case of groups which have complicated chain structure. On the other hand, the algorithms based on determining the farthest neighbor distance are suitable when dealing with specific case of groups that form spheroid clouds in a feature space. The centroid distance algorithms occupy the intermediate position and satisfy the specific case of groups of objects with ellipsoid shape.
Problem of grouping spots based on their color features can be easily solved because typically it is only needed to define not more than two groups.
First, the farthest spots from the whole set of detected spots are determined. If there are only two clusters, then these spots must belong to different clusters and proximity measure is defined according to Eq. 5.
Then, the iteration is done on all other spots and they are associated with either first or a second cluster corresponding to their distance from the earlier-found farthest spots.
Finally, Eqs. 4 and 6 may be used as a proximity criterion for clusters. If the distance calculated according to above formulas is less than some critical value, then the subdivision of two clusters is not valid: there are more than two clusters in the set of objects. The critical value is defined on the basis of specific additional demands of how many colors in clusters must be different.
If a pure mathematical description of the object is difficult to perform, then the problem of form construction (construction of regions of constant brightness) can be solved using the real image of such an object.
Let us represent the image f for constructing form as follows:

where Ci – the brightness in ith region; Xi(x, y) – indicating function of ith region which is equal to 1 in region points and equals to 0 elsewhere (see Note 2).
Let us use the following algorithm of optimum irregular division. First, we make regular uniform division and calculate the image Pff. This image has brightness levels C1i, i = 1, n. Then, we divide image f on intervals with mean values equal to C1i. After that, we repeat image calculation Pff and get brightness levels C2i. We can continue making such iterations until brightness levels stop changing.
Such algorithm may be called the algorithm of optimal image approximation by step functions (Eq. 2). This algorithm leads to division of interval of image brightness levels on n intervals with no more than one region of constant brightness of image f.
To speed up the algorithm convergence, we can choose nonuniform initial levels of division correlating with the histogram of the brightness levels of the image. In such a division, we have more levels which are more frequent in the histogram.
The described method is a useful mathematical foundation of software application for counting spots in ELISPOT assays. However, a mathematical method is not sufficient itself for obtaining accurate and reliable quantification results (see Note 3).
It has to be pointed out that the information about the mean value of spots dimensions and a mean value of their deviations is of critical importance and without it for computer software it is impossible to correctly interpret whether too small and too big spots are relevant or not (see Note 4).
That is why many other systems need precise manual adjustments to compensate for different image capture conditions. Using algorithms described above, we have developed a QuantiHub software which utilizes a different approach: adjustments for fixed image capture conditions are done beforehand. QuantiHub software is capable of automatic processing of the images captured from the ELISPOT plates (including dual-analyte ELISPOT assays) in 1–2–3 predefined spot-counting modes.
QuantiHub version for single-color ELISPOT assays (Versions 3.6 or less) was released in 2002 and completely redeveloped in 2010 (Version 4.1) allowing quantification of both single-analyte (single-color detection) and two-analyte (dual-color detection) ELISPOT assays. The system utilizes Unibrain Fire-i 785c camera and allows for accurate quantification results without the necessity of manual adjustments of the system during image acquisition at different illumination conditions.
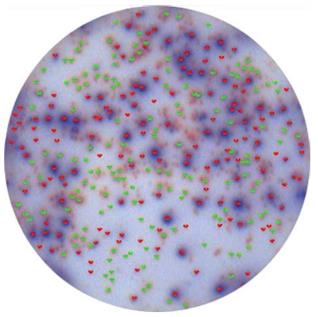 Figure 1. Typical dual-color ELISPOT detection results using the "Enhanced" counting mode in QuantiHub 4.1 software.
QuantiHub Version 4.1 has two predefined counting modes – Fast and Enhanced. The Fast mode is less time consuming and can be used on a vast majority of ELISPOT assays, whereas the Enhanced mode needs more time and is intended for rather difficult situations, such as when there are too many spots and many of them almost merge with each other and have a low contrast. In addition to a desktop version, QuantiHub 4.1 is available as a Web service to researchers who prefer to be flexible in analyzing their ELISPOT images loaded from laboratories located in different places.
Investigators, who wish to develop their own ELISPOT quantification software, can utilize information provided in this chapter which can save them a software development time and help to design a robust spot recognition and quantification desktop application.
Reference
Loading ......
