
Inquiry Basket
 Loading ......
When working in a laboratory setting, it is often necessary to perform quantitative measurements of analytes in samples. In order to do so, we must first create a standard curve, which allows us to relate measured values to the concentration of the analyte in question. Creative Diagnostics provides customers with professional technical guidance on how to use a standard curve to calculate the concentration of unknown samples.
A standard curve is a graphical representation of the relationship between the concentration of a substance and a measured response. The substance can be anything from a protein to a small molecule, and the response can be any measurable property, such as absorbance, fluorescence, or luminescence. The purpose of the standard curve is to establish a relationship between the measured response and the concentration of the substance.
Standard curves are used in various assays, such as ELISA, western blot, and PCR, to quantify the amount of a target molecule in a sample. They are generated using a set of known standards, usually in the form of a series of dilutions of a stock solution, and a calibration curve is plotted using the measured values of the standards.
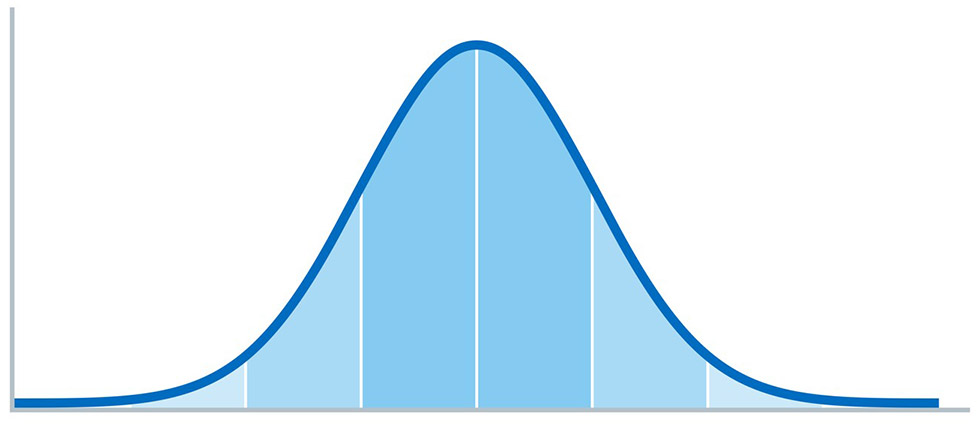 Fig 1. Standard Curve
| 1. Check the protocol booklet | To determine if a standard curve is required for a kit, it is important to consult the protocol booklet. Standard curves are typically necessary for quantitative measurement of concentration, as opposed to semi-quantitative or qualitative analysis. |
| 2. Prepare the standard solutions | Prepare a series of dilutions of a stock solution to create a range of known concentrations of the target molecule. The dilutions should cover the expected range of concentrations of unknown samples. |
| 3. Prepare an assay plate | Add the diluted standards and the unknown samples to the appropriate wells of the assay plate. It is important to label the wells appropriately to avoid confusion. |
| 4. Measure the response | Test the standard response and the unknown sample response using the appropriate method. The response can be absorbance, fluorescence, or luminescence, depending on the assay. |
| 5. Plot the calibration curve | Plot the measured response of the standards against their known concentrations. The resulting graph should show a linear relationship between response and concentration. |
| 6. Analyze the plot to determine the trend | To analyze results from a specific kit, it is important to refer to the protocol booklet for specific instructions on data analysis. ELISA data are commonly plotted as a sigmoidal curve, and a four-parameter curve fit (4PL) is usually used to analyze it. However, other models may be used if they provide a better fit. For other kits that display approximately linear behavior, a linear trendline is appropriate for analysis. |
| 7. Calculate the Concentration of the Unknown Sample | Use the calibration curve to determine the concentration of unknown samples based on their measured response. This is done by finding the point on the calibration curve that corresponds to the response of the unknown sample and reading the concentration. Ensure that all samples are within the range of the standard curve. If the signal exceeds this range, it is necessary to dilute or concentrate the sample appropriately. |
* It is important to follow proper experimental design and analysis protocols to ensure the accuracy and reliability of the standard curve. This includes using appropriate controls, replicates, and statistical analysis to minimize experimental variability.
To avoid standard curve failures, project delays, and waste of time and resources, there are some tips that can help us prevent potential pitfalls when preparing standard curve standards, including:
Creative Diagnostics is a leading provider of research tools, including antibodies, proteins, and assays, for use in life science research. Our products are rigorously tested and validated to ensure accuracy and reproducibility, making them ideal for generating accurate standard curves. These kits come with pre-made standards, protocols, and technical support to ensure reliable results. The kits are also customizable, allowing researchers to choose the appropriate standard concentrations and calibration ranges for their specific needs.
Overall, standard curves are a crucial tool in life science research for quantifying the amount of a target molecule in a sample. By following the proper procedures for generating, testing, and using standard curves, researchers can obtain accurate and reliable results. Additionally, by using high-quality products and services from Creative Diagnostics, researchers can ensure the accuracy and reproducibility of their results, advancing our understanding of the biological world.
Loading ......
