Introduction of Fluorescent-Activated Cell Sorting
Flow cytometry in the clinical setting is based on the basic characteristic of common cells found in the blood, bone marrow, and lymphoid tissue. Each of these cell types expresses a particular combination of antigens, predominantly on their surface, also known as cell immunophenotype. This characteristic allows us to identify each cell type in a specimen. Neoplastic cells found in hematolymphoid neoplasms also have a specific immunophenotype that deviates from their normal counterparts.
Compared with other methods, flow cytometry is typically faster, providing a result within hours of specimen collection. The fundamental prerequisite for all standard clinical flow cytometric analyses is a population of viable cells in a single cell suspension. The components of a flow cytometry system consist of the (1) specimen, which contains the cells of interest; (2) antibodies with fluorochromes to specific antigens; (3)fluidic system that allows a single cell analysis; (4) laser and detector that measures the emitted light; and (5) computerized analysis system that will help to translate the light signal.
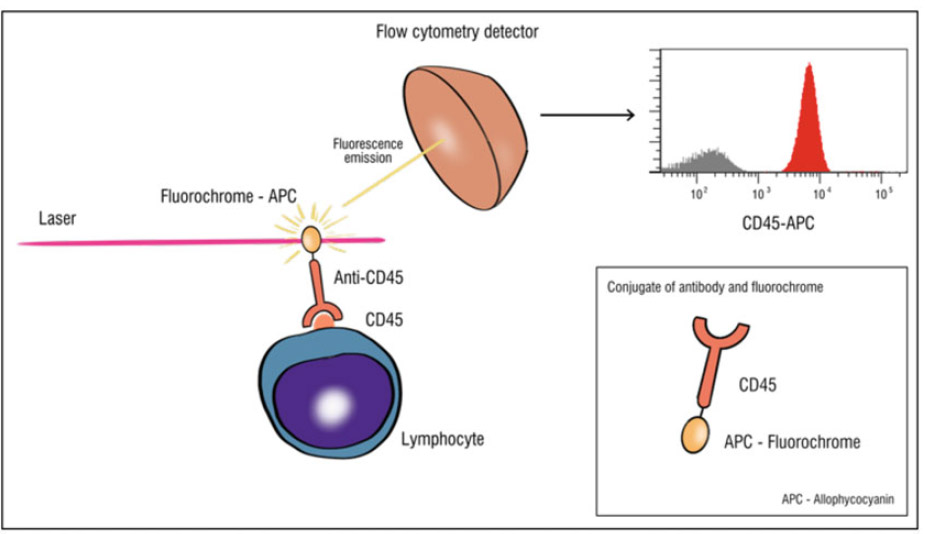 Figure 1. Flow cytometry principle.
Flow cytometry is based on antibodies labeled with fluorochromes that recognize antigens present on the surface, cytoplasm, or nucleus of cells. The fluorochromes are molecules that can absorb light from laser at a specific wavelength and reemits energy at a different wavelength. The emitted light has a different wavelength that is typically longer because it demonstrates lower energy. This light is sensed by the detector, which generates an electrical pulse. The intensity of the pulse is proportional to the total amount of light emitted. The flow cytometer can tell not only the presence of the markers but also their relative amounts on the cells.
The flow cytometer can also detect nonfluorescent light that is reflected at 180° or 90° from the light source. The former is also known as forward scattered, and its intensity is proportional to the size of the cell. The latter is called side scatter, and its intensity is proportional to the complexity of the cells. Each cell will generate a signal represented in two-dimensional histograms, which allows us a combination of parameters. The cells will form clusters that represent groups with common lineage markers or functional characteristics. Flow cytometry analysis software helps us separate these clusters in different colors and visualize them in different histograms; this process is called gating. Software programs utilize multiparameter gating strategies to identify cell populations and their reactivity. Variable CD45 positivity is ideal for locating and distinguishing abnormal cells from normal components in all types of specimens.
The specific grouping of antibodies into panels can be used to determine the phenotype of a hematological disease. All panels are designed by selecting the appropriate antibodies, fluorochrome combination(s) and using appropriate software to identify the cells of interest and normal cell counterparts.
The current expert consensus to determine antigen positive vs. negative reactivity is to use the internal negative populations in the sample as the lowest level of expression to judge any positivity. Each tube used should show populations that are mutually exclusive of each other's immunophenotypic characteristics (i.e., T and B cells) and can be used to establish the placement of markers for identifying the negative position within the tube. Different populations have a unique and unpredictable expression of antigens and frequently express antigens at a low density. Using internal cell populations that may or may not express the antigen as well as the axis placement of the population of interest can give a complete evaluation of the antigen expression in different populations of interest.
Each phenotype panel is designed to aid in making a diagnosis of acute leukemia as well as B and T cell lymphoproliferative disorder. Panels are set up to include all relevant antibodies needed to identify blast cell lineage, aberrant expression of lineage markers, lymphocyte subpopulations, aberrant antigen expression on lymphocytes, and monoclonality (surface light chain restriction) of B cells.
Materials of Fluorescent-Activated Cell Sorting
Specimen Requirements and Criteria for Specimen Acceptability
Criteria for collection, identification, preparation, or rejection of specimens and ensuring proper test conditions for specimens are established from clinical laboratory wide protocols or protocols specific for flow cytometry analysis.
Nonacceptable Specimens
- Nonviable specimens.
- Specimens placed in formalin.
- Too few cells in analysis gate for accurate interpretation. (<20–50 events).
- These criteria may be determined before processing based on blast or lymphocyte counts or after analysis when “clean” gates cannot be established.
- Flow results from suboptimal specimens must be interpreted in context with all other laboratory and morphology information.
- Any reporting of results from poor quality specimens should note the quality of the specimen in the report.
Specimen Time Validation
Room temperature Na Heparin or EDTA Bone marrow syringes can be held up to 72 h prior to processing.
Equipment
- Flow cytometer.
- 5 ml polystyrene round-bottom tube.
- Disposable sterile 15 ml plastic conical centrifuge.
- 1 ml, 5 ml, and 10 ml disposable graduated pipettes
- Plastic transfer pipettes.
- Gauze, gloves, and centrifuge.
- Microscope and vortex mixer.
- Disposable hemocytometer.
- Gilson pipetman and pipette tips.
Reagents
Surface Assay
- Antibodies: All antibodies are used at the manufacturer's recommended concentration. Antibodies may be combined in batches according to recommended amount or in tittered amounts for the number of tests for each batch.
- Phosphate buffered saline with 1% Na azide (PBS/Azide): Phosphate buffered saline is used in preparation of some flow cytometry reagents as well as in washing excess antibody and fixative from processed cell suspensions. Sodium azide is added to the PBS as a preservative.
- FACS Lyse Solution: Dilute 100 ml FACS Lyse with 900 ml of distilled H2O. Mix for 10 min. Store in two glass 500 ml bottle at room temperature.
- NH4Cl Lyse for bulk lyse when needed (For processing tissues).
- Dulbecco's Phosphate buffered saline (PBS), without CaCl and MgCl, with added 0.1% sodium azide, and PBS with added HIFCS (2%).
- 5 l: dissolve powder contents of 5–1 l packets in 5 l of distilled H2O in 5 l beaker. Add 5 g sodium azide. Mix well. Pour into 500 ml media bottles. Store at 2–8°C. Six months expiration date.
- To prepare 100 ml PBS with HIFCS, pour 98 ml PBS with 0.1% Na Azide in small media bottle, add 2 ml of thawed HIFCS. Store at 2–8°C, 1 month expiration date.
- BD stabilizing fixative: Dilute 1:3 with distilled H2O, store at room temperature, 1 month expiration date.
- Trypan Blue 0.2%: Working solution for viability determination, in a 12X75 mm tube add 500μl of 0.4% Trypan Blue and 500μl PBS/Azide. Stable for 4 months at room temperature.
- PBS with 2% FCS (2% PBS).
- Fetal calf serum (FCS): Sigma F-4135-100 ml heat inactivated. Add 2 ml FCS to 98 ml PBS. Store at 2–8°C, expires in 30 days.
- Ammonium chloride (NH4Cl) lyse: Ammonium chloride solution is used to lyse erythrocytes in blood, bone marrow, and other samples submitted for flow immunophenotyping, leaving a pure leukocyte cell suspension.
Cytoplasmic/ Intranuclear Assay
- BD IntraSure Kit: Reagent A and Reagent B.
- FACS Lyse.
- Antibodies.
- Surface: use any antibody that the manufacturer has stated or has been tested to survive the intracellular procedure.
- Intracellular antibodies: Becton-Dickinson.
- Anti-terminal-deoxynucleotidyl transferase: Anti-TdTPE.
- Anti-human myeloperoxidase: MPO-FITC.
- Anti-CD3-APC.
- Anti-79a-PerCP-Cy5.5.
- Positive Controls.
- TdT: TdT Positive Control Cells.
- Preserved tissue culture lymphoblast cells containing 50% TdT+ cells and 50% TdT-cells. Use the internal negative population in place of isotype control. Use one to two drops per test. Expiration date is determined by manufacturer.
Cell Concentration/ Antibody Optimization
Based on specimen source, different methods to determine the cell count/concentration are employed.
- Peripheral blood—CBC parameters with WBC count.
- Lymph Node/Soft tissue, FNA, CSF, body fluids—hemocytometer. Cell count adjusted to less than 5X10⁶/ml, NH4Cl prelyse, if needed, then stain.
- Bone marrow:
- Validation studies revealed 85% of bone marrow aspirates had cell counts of about 1/2 one million in 50μl of specimen.
- The validation data using multiple aliquots bone marrow (50, 100, 200μl) which provides separate cell concentration on five different cellular types of bone marrow.
Surface Assay
- 50–100 μl unwashed whole BMR or blood.
- Body fluids—Cell count should be >5/μl (using hematology cell count performed using Sysmex instrument in Hematology lab).
- Soft tissue—Cell count should be >5/μl (cell count performed using hemocytometer). Preparing Cell Suspension for solid tissue, body fluids, CSF, FNA specimen, using Lyse/Stain/Wash.
Cytoplasmic Assay
- 50 μl whole bone marrow or blood washed 2 times in 15 ml PBS.
- Resuspend in 0.5 ml 2% PBS.
Methods of Fluorescent-Activated Cell Sorting
Acute Leukemia, Chronic Leukemia, and Lymphoma Panels
Whole Blood and Bone Marrow
- For acute leukemia panel: use 50–100μl unwashed specimen then perform stain/lyse/wash procedure (100μl typically used in low cellular specimen).
- For Lymphoma/Leukemia panel, wash 0.5–1 ml blood or bone marrow with PBS/Azide, resuspend in 0.5–1 ml 2% PBS then perform stain/lyse/wash procedure.
Stain/Lyse/Wash Procedure
- Label a 12X75 mm tube with patient name, date, specimen type and panel tube name.
- Pipet 40μl of eight color batch antibodies, or single amounts of individual antibodies for nonbatched tubes.
- Pipet 50–100μl of specimen into each tube, vortex.
- Incubate for 15 min in the dark at room temperature.
- Pipet 2 ml of FACS Lyse, vortex, and incubate in the dark for 10 min at room temperature.
- Centrifuge at 1200 rpm for 5–7 min and aspirate supernatant leaving cell pellet undisturbed.
- Pipet 2 ml of PBS/Azide and vortex to resuspend cells.
- Centrifuge at 1200 rpm for 5–7 min and aspirate supernatant leaving cell pellet undisturbed.
- While vortexing tubes add 300μl of BD Stabilizing Fixative.
- Cap tubes and store at 4°C until analyzed.
For Tissue, FNA, CSF and All Other Body Fluids
Perform the Lyse/wash/ stain procedure using a cell suspension with cell count adjusted to 5X10⁶/ml or less.
Lyse/Stain/Wash Procedure
- Label a 12X75 mm tube with patient name, date, specimen type and panel tube name.
- Pipet 40μl of eight color batch antibodies, or single amounts of individual antibodies for nonbatched tubes.
- Pipet 50–100μl of specimen into each tube, vortex.
- Incubate for 15 min in the dark at room temperature.
- Pipet 2 ml of PBS/Azide to each tube.
- Centrifuge at 1200 rpm for 5–7 min, aspirate supernatant without disturbing cell pellet. Aspirate all PBS. While vortexing, fix with 0.3 ml FIX. Check all tubes for cell clumps and filter before acquisition.
- Cap tubes and store at 4°C until analyzed.
Procedure: Eight Color Cytoplasmic Acute Leukemia Panel
- Label a 12X75 mm tube with patient name, date, specimen type and panel tube name (Cytoplasmic). Label a second tube for TDT control cells.
- To patient cytoplasmic tube add appropriate antibodies for surface staining. Add 50μl of whole blood, bone marrow, or processed cells to each tube and incubate for 10–15 min at room temperature in the dark.
- Add 5μl CD45 antibody and one to two drops of TdT control cells to separate TdT control tube. Incubate for 10–15 min at room temperature in the dark.
- Add 100μl of Reagent A to all tubes. Vortex and incubate for 5 min at room temperature in the dark.
- Add 2 ml of FACS Lyse to all tubes, vortex, and incubate for 10 min at room temperature in the dark.
- Centrifuge at 1200 rpm for 5–7 min and aspirate all supernatant from tubes. Do not leave any residual FACS Lyse to dilute the IntraSure reagent B.
- Add 50μl of Reagent B to all tubes. Add 25μl of batch or appropriate amount of each cytoplasmic/intranuclear antibody to tube, vortex, and incubate for 15 min at RT in the dark.
- After incubation, add 2 ml of PBS and centrifuge at 1200 rpm for 5–7 min.
- Aspirate all supernatant and while vortexing tubes add 300μl of Fix.
- Cap tubes and store at 4°C until analyzed.
Instrument Setup (Based on Specific Flow Cytometer)
- Place first tube of panel under the aspirator tube.
- Select acquisition speed of medium, select acquire specimen, observe for flow/event rate, if below 10,000/s set acquisition speed to high and select record.
- After events are recorded remove tube from aspirator and select next tube. Repeat until panel is complete.
- If applicable, change from acquisition to analysis template by clicking on the global worksheet icon.
- Adjust gates to define populations of cells, review histograms to increase or decrease events displayed to properly set quadrants defining positive/negative populations, print out. Return events to original settings and print out.
Acquisition
Typically acquire events between 50,000 and 100,000 for the phenotype analysis depending on default for panel.
Software Analysis Strategy
The software package is designed for a digital flow cytometer. It consists of the software for acquiring and analyzing data.
Software Results Reporting
The laboratory report consists of a description of the abnormal cells or immunophenotype as well as the degree of involvement (%total) of the abnormal population. A descriptive interpretation summary made by the pathologist is included in the diagnosis section. Any additional descriptions or comments describing the abnormal cells may also be included in the comment section of the report. The final report consists of the results and interpretation.
Results
Due to the varied nature of defining hematopoietic neoplastic cells in a background of normal cells conventional reference ranges are not reported. The identification of abnormal cells by phenotypic expression that is characteristic of malignant cells is the pertinent result. The number of abnormal cells identified in the total cell population is reported as an indicator of the extent of involvement in that sample. Internal normal cell populations also help establish cell populations with any aberrant antigen expression. Staining patterns used in identifying the abnormal population are established from accepted literature and guidelines.

 Loading ......
