
Inquiry Basket
 Loading ......
ELISPOT is the only assay available today that is suited to measure the secretory activity of individual cells. However, the exact relationship between spot morphology and the basic parameters of the secretory process remains unresolved. The ability to directly measure the amount of cytokine produced by individual T or B cells ex vivo may open a yet underutilized dimension for ELISPOT analysis and may contribute to a better understanding of these cells' functions. T-cell ELISPOT assays performed on PBMC invariably reveal a wide range of spot sizes and morphologies, and there are multiple lines of evidence which suggest that the variation in spot size/density is linked to a biological correlate. In this regard, the amount of cytokine secreted by individual antigen-specific T cells, rather than differences in their frequencies, was found to be one of the factors responsible for the immune deficiency in individuals with HIV. Cytokine productivity accommodated in a spot size-based model allowed us to explain the relapsing nature of the autoimmune disease, experimental allergic encephalomyelitis (EAE), while accounting for T-cell responsiveness to antigen with the use of a single parameter (spot size variability). The functional avidity of T cells for antigen can be established by titration of the antigen. In such assays, the spot size and the strength of T-cell stimulation are positively correlated: increased by a higher antigen dose or by the addition of a costimulatory antibody. For different cell types producing the same cytokine, like CD4, CD8, or NK cells, we reported clearly different spot morphologies. Spot morphologies also vary for different cytokines (IFN-G, IL-2, Granzyme B, IL-4, and IL-10) when produced by the same cell type (e.g., CD4 cells).
Defining the exact relationship between spot morphology and the kinetics of cytokine secretion may, therefore, add additional information about the biology of the secreting cells and their interaction with other cell types or reveal pathological conditions. Therefore, the development of a quantitative model for the analysis of spot morphology should be important for extracting high content information contained within ELISPOT results, adding valuable immune diagnostic information. On the practical end, thus far, the process of selecting antibodies suitable for ELISPOT assays was done purely on an empirical basis because antibodies performing well in ELISAs many times did not work at all in ELISPOT. An understanding of the relationship between spot morphologies (size, density, and diffuseness) and the binding properties of the antibodies can help facilitate the selection process.
Although it is somewhat intuitive that both spot size and density should reflect a cell's productivity, the challenge for establishing the exact relationship is that the dynamics involved are multiparametric and highly complex. These include the analyte secretion rate, the net amount produced, and its binding and lateral diffusion as defined by the capture antibody's affinity for the analyte. In this chapter, these relationships are addressed using a mathematical model which is confirmed by comparing the results obtained in silico with data generated in real ELISPOT assays. All what is described in the following for the classic enzymatic detection of plate-bound analyte by ELISPOT applies (with minor variations that are specified) for FLUOROSPOT assays as well.
The proposed model assumes that the secreting cell (G) is located on the surface of an ELISPOT well membrane which is coated with anti-analyte capture antibody. The membrane surface is two dimensional (XY) and the space above the membrane is three dimensional (XYZ), where dimension Z represents the distance from any point in the well to the membrane. In this model, the interaction of the analyte with the capture antibody occurs on the membrane surface, whereas diffusion of analyte in the half-space above the membrane. Relative to the size of the cell, the area of the membrane, and the liquid volume above, it can be considered infinite.
The diffusion of the secreted analyte is described by the equation:

Where  is the Laplace operator, D is the analyte coefficient of diffusion (m2 /s), C is the concentration of the analyte in the solution (1/m3), and t is time in seconds. The interaction of the analyte with the capture antibodies on the surface of the membrane (at z = 0) is a reversible heterogenic reaction of second order and can be described by the standard equation:

whereby N and N* are surface concentrations of the analyte bound and total antibodies (bound plus free) (in 1/m2), and k+ (in m/s) and k− (in 1/s) are kinetic constants of direct (binding) and reversed (dissociation) reactions on the surface, respectively. Please note that the association rate constant k+ is expressed in unusual units. This is because the concentration of capture antibodies on the membrane is expressed in units of surface concentration (1/m2) and that of the analyte as volume concentration (1/m3). Term  represents the fraction of free antibody-binding sites (not occupied by analyte) on the membrane surface. At time zero (t = 0), the cell is not yet secreting, and the concentrations of the analyte and occupied antibody-binding sites are:

Diffusion of analyte away from the surface can be described as:

It is directly proportional to the cell productivity – q (in 1/s) – and to the dissociation rate of the analyte from the surface and inversely proportional to the rate of analyte binding to the antibodies on the membrane.
The source of the secretion (the cell itself) is localized in a circular region G on the surface z = 0. Outside of this region, the productivity of the source is q = 0 (in numbers of analyte molecules per unit of time). We also assume that far from the surface, the concentration of the analyte is equal to zero:

The goal, then, is to define the distribution function for the concentration of bound analyte on the membrane surface around the cell (i.e., the distribution of the bound analyte within the spot), N(x,y,t), and, from that, the function of the spot size (the region where the surface concentration of bound cytokine is different from zero for a fixed value) for time and cell productivity. This fixed threshold value Nl is the detection limit. Strictly speaking, spots do not have defined sizes. Rather, at the periphery, the density of spots asymptotically reaches zero at the distance from the secreting cell  .
.
A system of differential equations with an initial condition and boundary conditions that are not linear cannot be solved in an analytical form (i.e., as a mathematical formula). Only numerical solution can be obtained (which is discussed later). To transform it into a linear system and to solve the problem in the analytical form, we have to make the additional assumption that the concentration of the capture antibody on the membrane is much higher than the concentration of the analyte. In this case, the membrane surface concentration of free antibody-binding sites is always equal to its total number: N* (term  ). This condition is true for membranes that have high antibody-binding capacity (such as PVDF) and when the cell's productivity is low. While this simplification is applicable only to certain assay conditions, it is valuable for defining the basic mathematical principles which describe ELISPOT.
Therefore, Eq. 2 can take the linear form:

with simplified boundary condition:

Leaving aside further mathematical details as outside of the scope of this chapter, we affirm that the solution of the linear task (Eq. 1), (Eq. 6) with boundary condition (Eq. 7) can be obtained for the total amount of analyte bound in the spot area (N0):
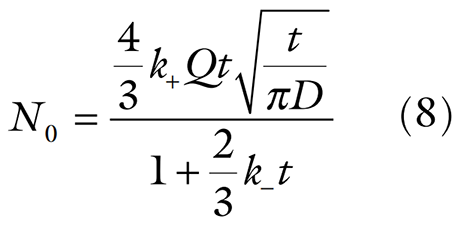
and for the characteristic radius of the spot (R):

where RC is the diameter of the cell.
The density profile of the spot, i.e., the concentration of occupied antibody-binding sites (N) versus the distance from the center of the spot (r) can also be reconstructed if we approximate a bell-shaped spot density profile with a normal distributed function.
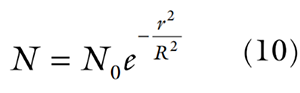
The result is a logarithmic function of spot radius versus cell productivity:

whereby r* represents the radius of the spot at a defined time point, t; Q is the total productivity of the cell; and Nl is the spot detection limit. Since the normal distribution function (and real spot density) asymptotically reaches zero density with r, for practical reasons we define spots (with radius r*) as areas where density is equal to or higher than the threshold defined by our detection limit.
For the same type of assay (same analyte, capture antibody, and cell size, and with fixed incubation time), the radius of the spot is proportional to the square root of the natural logarithm of cell productivity. In other words, the area of the spot is linearly proportional to the natural logarithm of cell productivity:

where S* is spot area.
A more general, nonlinear case solution can be obtained only by computer modeling. A numerical solution for the more general, nonlinear case also followed closely a logarithmic function (Eq. 12), supporting the assumption we made about a normal density distribution of the spots. The close correlation between the two solutions supports our major conclusion about the area of the spot being linearly proportional to the natural logarithm of cell productivity (see Note 1). The typical range of spot size distributions seen in ELISPOT assays for different cytokines spans two to three orders of magnitude. Because of this logarithmic relationship between spot size and cell productivity, one can assume that the productivity of cells can span a range of several orders of magnitude.
Another parameter which reflects the secreting cells' productivity is the peak intensity of spots. It is intuitive to assume that the peak intensity in the center of the spot should be proportional to cell productivity, and indeed our linear model solution confirms it. However, in reality, linear conditions often are not satisfied. For example, for cells that are strong producers, the secreted analyte saturates the capture antibodies close to the center of the spot, and in those areas further analyte cannot be bound. Subsequently, the spot profiles take on the appearance of a "Table Mount", i.e., display an extended plateau in the center. Thus, peak spot intensity vs. cell productivity is linear only in the range of low productivities (when linear conditions are satisfied), but reaches a plateau when antibodies begin to be saturated by excess of analyte. A total amount of bound analyte in the spot (N0) is also directly proportional to productivity (Q) when linear conditions are satisfied (equation 8). With the increase of Q it does not plateau (like peak intensity) but changes into a logarithmic function similar to one of spot area vs. productivity. In practice the amount of bound analyte can be measured only when it exceeds the sensitivity threshold resulting in nonlinear relation even for low cell productivity (i.e. in small spots big fraction of bound analyte stays undetected). Therefore spot size is the only parameter linked to cell productivity by a single known mathematical function in all cases regardless of the experimental conditions (see Note 2).
Our mathematical model of ELISPOT formation also allows us to predict how different analyte secretion rates are reflected in different spot morphologies, which in turn are also influenced by certain assay parameters, namely the density of capture antibody on the surface of the well, its relative affinity for the specific analyte, or, to be more precise, its association and dissociation kinetic constants (see Note 3). Since these relations are complex, we dissect them in the following using computer simulations.
For each productivity rate, the spot growth decreases with time. Also, there is a noticeable lag period for low producers during which spots are not yet detectable due to the set detection limit.
The spots continue growing as long as the cells keep secreting analyte, but what happens if the cells stop secreting while the incubation continues? Due to the reversible nature of the binding between analyte and capture antibody, the spot sizes continue to grow even after secretion stops while at the same time the spots' peak densities decrease. The spots grow larger, but fainter. This happens because, in the absence of replenishment through secretion, the concentration of free analyte near the membrane surface drops instantly. The decrease of free analyte concentration in turn shifts the equilibrium of the antibody–analyte binding reaction and leads to a dissociation of bound analyte. Some of the dissociated analytes diffuse laterally and are recaptured resulting in the continued growth of the spot size. Most of the dissociated analytes, however, diffuse away from the surface into the supernatant. If this process continues long enough, the spots disappear completely. Overincubation of cells in culture is one of the reasons why spots can appear "diffuse." To obtain quality spots, and for correct quantitative measurements of per cell productivity, it is important therefore to match the ELISPOT assay's duration with the actual secretory activity of the cells (see Note 4). Shorter or longer assay periods underestimate the per cell productivity.
Properly performing ELISPOT assays require carefully selected antibodies. The selection of antibody pairs that work well for ELISPOT assays has been a tedious empirical process – some, but not all, ELISPOT kit manufacturers have selected carefully. It is well-known that antibodies recommended for ELISA or intracyto-plasmatic cytokine staining (ICS) often do not perform well for ELISPOT. At a closer look, most of the problems occur with the coating (primary) antibodies. There are three different reasons why these antibodies have a major impact on capturing analyte. First, there is the difference in affinities of antibodies for the ana lyte; second, even for antibodies of the same affinity, the association and dissociation kinetics are critical (see below); and third, the affinity of the capture antibody for the membrane results in differential coating densities between different capture antibodies. With our model at hand, one can analyze in which way each of these three factors affects spot morphology.
Antibody affinity (for monovalent binding) or avidity (for bi- and polyvalent binding) describes the antibody–antigen (here, analyte) equilibrium binding constant, and is defined by the ratio between the association and dissociation rate. First, let us assume that the association rates are the same for two antibodies, and the difference in their affinity results from different dissociation rates. The antibody with the slower dissociation rate constant (and therefore with the higher affinity) produces larger and also brighter spots (see Note 5).
Importantly, affinity alone does not suffice to describe spot formation. Antibodies with highly different association/dissociation rate constants can have an identical affinity for the analyte as long the ratio of association/dissociation stays the same. Let us consider two antibodies with the same affinity; for one of these antibodies, both the association and dissociation follow a fast kinetics; for the other antibody, association and dissociation follow a slow kinetics. Our model predicts that the two antibodies will produce highly different spots. For moderate to high secretion rates, the antibody with the fast association/dissociation rate produces spots with the same peak density, albeit larger in size as compared to the antibody with the "slow" kinetics. This effect of binding kinetics on spot morphology results from the fact that antibodies with "fast" association kinetics have a greater chance of capturing the analyte before it diffuses away from the membrane. With "slow" kinetics, spots are reduced in size, but their peak value (which mostly depends on the equilibrium constant) stays basically the same due to high local concentration of analyte at close proximity to the cell.
Thus, the kinetics of antibody binding mostly affects spot sizes and does not much alter their peak densities – spots do not tend to become more "diffuse" with "slow" kinetics. However, low analyte secretion rates combined with "slow" binding kinetics of the capture antibody can result in the analyte not binding at all and its secretion going undetected.
Therefore, in addition to a high equilibrium constant (high affinity) for the analyte, a capture antibody which displays ideal properties for use in ELISPOT must also have a high association rate (see Note 6). For selection of such antibodies, direct kinetic measurements (e.g., using BIOCORE instruments) are recommended in addition to conventional affinity measurements.
In addition to the capture antibody's binding properties versus the analyte, its binding affinity for the membrane is critical for its performance in ELISPOT assays. Our computer simulation shows that high surface density of capture antibodies on the membrane results in tight and bright spots, whereas low density leads to bigger spots which lack a dark center ("diffuse" spots) (see Note 7). Coating of plates with capture antibody relies on hydrophobicity dependent physical adsorption. For high-density coating, therefore, both the membrane and the antibody need to be hydrophobic. The results of the above simulation closely reproduce the experimental spot density distributions seen when ELISPOT assays are performed using PVDF (highly hydrophobic) or mixed cellulose ester membranes. So far, PVDF membranes, which our group introduced for use in cytokine ELISPOT assays, provide the highest density of antibody coating compared to other plate/ membrane types.
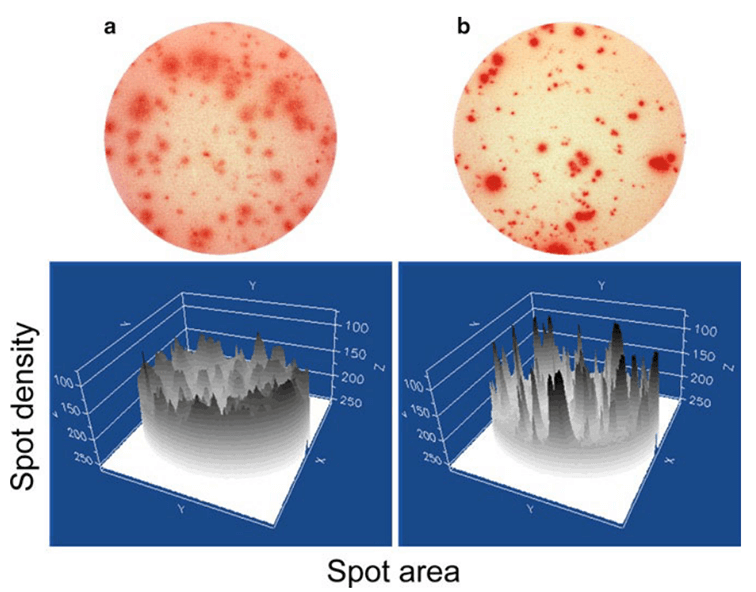 Figure 1. Experimental spot morphologies at low (a) and high (b) density of antihuman IFN-G capture antibodies on MAHA and PVDF membrane plates (Millipore).
Coating PVDF membranes through physical adsorption results in a high enough density of capture antibodies for single- and dual-color ELISPOT assays. However, our calculations and experimental data both suggest that for three and more color assays, the surface density of the individual capture antibodies drops below the optimal level, as the antibodies compete for the limited number of adsorption sites. New coating principles have to be developed for multiplexing ELISPOT assays beyond two analytes.
In our considerations so far, we have taken into account only the concentration of the membrane-bound analyte (along with the contribution of the coating antibody) to build density distributions of spots. How do secondary antibodies and the subsequent detection steps affect spot morphology? Because there is no competition between analyte binding by antibodies and free analyte diffusion during the secondary detection step, the characteristics of secondary (or detection) antibodies do not affect spot morphology much (see Note 8). Similar to conventional ELISA assays, low affinity of detection antibodies can be compensated by higher antibody concentrations and/or longer incubation times (see Note 9). Classically, indirect methods have been used to detect the membrane-bound analyte involving biotinylated secondary antibodies, followed by addition of enzymatically labeled streptavidin (tertiary reagent) and substrate. In most cases, the secondary antibody and the tertiary reagent are present in much higher concentrations than their corresponding affinity constants, i.e., they are added in excess. In such cases, the final signal detected is linearly proportional to the concentration of the bound analyte. The same is applicable to enzymatic detection steps. The substrate concentrations in ELISPOT assay are also much higher than the Michaelis–Menten constants for the enzymes used. In this setting, the speed of substrate conversion is linearly proportional to the bound enzyme. With some limitations discussed below, the enzymatic detection system therefore reveals the concentration of analyte bound on the membrane – the secondary antibodies and the subsequent detection steps do not significantly affect the spot morphology.
Substrate buildup can, however, obscure the exact optical measurement of the amount of precipitate in a spot. Most substrates used for ELISPOT assays are not transparent, and after a certain "buildup" they reach a maximal optical density (this would be a situation analogous to painting a car with multiple layers of nontransparent paint). Such substrate "buildup" causes a plateau in the middle of the spot similar to when an excess of analyte blocks all capture antibodies around the secreting cell (see above). The use of backlight can help to distinguish between the two types of plateaus, however. Flat spots generated by excess analyte stay flat when backlit, but substrate buildup becomes visible when backlight is turned on. In general, the detection of flat spots indicates that the maximum or total density of spots is not proportional to cells' productivities and is not a good parameter to estimate cytokine secretion rates.
During our above analysis of ELISPOT formation, we did not mention the "ELISA effect." This results when large quantities of analyte avoid being captured around the cells and diffuse into the supernatant. Eventually, this analyte is also captured on the membrane, but instead of spots a carpet-like coloration is seen. Low affinity, slow-binding kinetics and low surface density of capture antibodies create an ELISA effect, as does the overproduction of analyte, e.g., after mitogen stimulations (see Note 10). The coloration is proportional to the concentration of the analyte in solution and, therefore, to the number and productivity of the secreting cells in the well. It cannot be accurately accounted for in our single cell-based model. Extensive ELISA effects affect spot morphology measurements, obscuring detectable spot size and peak density of the spots. The automatic correction of camera exposure times, which is a feature of ImmunoSpot® Analyzers, and the use of backlight, however, are sufficient to obtain accurate spot counts even when major ELISA effects occur.
In the above, we did not explicitly address the issue of asynchronous cell secretion. One cell can give a short burst of analyte release, whereas another cell may release slowly but steadily over a longer period of time. If the same total amount of analyte was secreted during a short period of time, cells which have a delayed but faster release will produce smaller and brighter spots. If one cell secretes faster, but stops secretion much earlier than the other, the residual spot (for the same total amount of the secreted analyte) will be bigger and less dense – "diffuse". Two distinct types of spots (normal vs. diffuse) detected with the same capture antibodies may point to different subpopulations of cells producing the same analyte, but with distinct activation/secretion kinetics (see Note 11). Asynchronous production needs also to be considered when the production of different analytes is measured in two-color ELISPOT, as their kinetics may differ. For example, IL-2 and IFN-G production by human antigen-stimulated T cells peaks within 24 h, whereas the secretion of IL-4, IL-5, and IL-17 does not even begin by 24 h following stimulation and peaks at around +72 h. Such different secretion kinetics are not, however, an obstacle to detecting the numbers of the respective analyte-producing cells: for example, IFN-G - and IL-17-secreting cells can be readily detected in a double-color IFN-G /IL-17 assay of 72 h duration. However, when assessing spot morphologies, the IFN-G spots are fainter and larger than in a 24-h assay due to the diffusion that occurs after the IFN-γ secretion has stopped. For accurate productivity measurements, analytes should be chosen whose secretion kinetics is similar, e.g., IL-2 and IFN-G or IL-4 and IL-5.
As the field progresses toward multiplex measurements, increasingly fluorochrome-labeled detection antibodies are being used for the visualization of plate-bound analyte. Such FLUOROSPOT assays have principal advantages over the classic enzymatic variant. First, FLUOROSPOT can be multiplexed for the detection of at least six analytes in the same well. Second, the fluorescence intensity is directly proportional to the amount of analyte and label bound in the spot area. There is no substrate conversion amplification step. Unlike for traditional ELISPOT, no substrate buildup can occur leading to the underestimation of the signal intensity. For exact quantitative measurements of plate-bound analyte (cell productivities) therefore, fluorescent visualization of spots is ideal, whereby all of the above considerations regarding analyte binding to the membrane apply (see Note 12).
Despite the aforementioned simplifications, our kinetic model (which considers only the surface density and binding characteristics of capture antibodies) suffices to provide a clear understanding of the spot morphologies seen in ELISPOT and FLUOROSPOT assays and to explain how these different morphologies are related to a cell's productivity. More than a decade of experimental work with ELISPOT and FLUOROSPOT performed in our laboratory has provided confirmatory data for this model. At the basic science level, a major contribution of this model is that it reveals the loga-rithmic nature of the relationship between spot size and productivity. Thus, it has become clear that the extent of variation in the cytokine secretion rate of T cells spans several orders of magnitude. Since most of the analytes which ELISPOT and FLUOROSPOT measure are bioactive molecules, one needs to assume that the biological significance of T cells secreting very low or very high amount of such molecules might be fundamentally different. Thus, it is possible that the weak producers do not secrete enough cytokine to perform effector functions, and would be mistakenly classified as effector cells. On the other hand, the T cells with orders of magnitudes higher productivity rates might be the key effector populations. The former might act only when they release cytokine in a targeted fashion: in direct cell-to-cell interactions, functioning as helper cells or as regulatory cells. The latter might secrete sufficient cytokine to generate effects in the wider surrounding tissues leading to local or systemic inflammation. ELISPOT and FLUOROSPOT are high-content assays that provide high-resolution information on individual cells' secretory activity. By studying spot morphologies beyond mere spot counts, we can gain new insights into T-cell biology and T cell-mediated immunity, adding a new dimension to immune diagnostics.
Reference
Loading ......
