
In 1971, Engvall and Perlmann published an enzyme-linked immunosorbent assay (ELISA) for the quantitative determination of IgG, which made the enzyme-labeled antibody technology used for antigen localization in 1966 to develop into a method for the determination of trace substances in liquid specimens.
The basis of ELISA is the immobilization of antigen or antibody and the enzyme labeling of antigen or antibody. The antigen or antibody bound to the surface of the solid phase carrier still maintains its immunological activity, while the enzyme-labeled antigen or antibody retains both its immunological activity and enzyme activity. In the measurement, the test specimen (the antibody or antigen in the measurement) reacts with the antigen or antibody on the surface of the solid carrier. The antigen-antibody complex formed on the solid phase carrier is separated from the other substances in the liquid by washing. Then the enzyme-labeled antigen or antibody is added, and it is also bound to the solid support through the reaction. At this time, the amount of enzyme on the solid phase is proportional to the amount of the test substance in the specimen. After adding the substrate of the enzyme reaction, the substrate is catalyzed by the enzyme to become a colored product. The amount of the product is directly related to the amount of the test substance in the specimen, so qualitative or quantitative analysis can be performed according to the degree of color. Due to the high frequency of enzyme catalysis, it can greatly amplify the reaction effect, so that the determination method can reach a high sensitivity.
ELISA detection methods mainly include: direct method, double antibody sandwich method, competition method and indirect method. This article focuses on the basic principles, operating methods, curve fitting and experimental techniques of competitive ELISA.
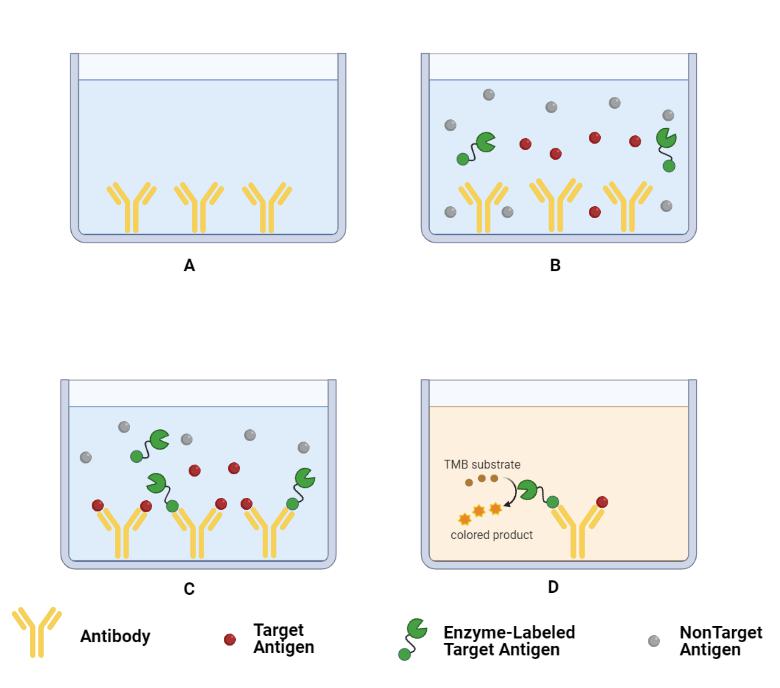
Principles of Competitive ELISA
Competitive ELISA is generally used to detect small molecule antigens. The small molecule antigen or semi-antibody lacks two or more sites that can be used as a sandwich method and cannot bind to two antibodies at the same time. Therefore, the double-antibody sandwich method cannot be used for measurement, so the competition method can be used. Generally used in the detection of small molecules, lgA, lgG, lgM, etc. The principle of this technology for antigen detection is that the antigen in the specimen competes with a certain amount of enzyme-labeled antigen to bind to the solid-phase antibody. The more the amount of antigen in the specimen, the less the enzyme-labeled antigen bound to the solid phase, and the lighter the final color.
The binding of antigen and antibody is a reversible reaction. When the reaction reaches equilibrium, the dissociation constant Kd=[A][B]/[AB], [AB] indicates the concentration of the antigen-antibody conjugate when the reaction is in equilibrium, [A] indicates the concentration of free antibody when the reaction is in equilibrium, [B ] Represents the concentration of free antigen when the reaction is in equilibrium. 1. When there are few antibodies in the reaction system and excess antigen, after the reaction balances [AB]>[A]; 2. When the amount of antigen in the reaction system is very small but excess antibodies, after the reaction reaches equilibrium [AB]<[A ]; 3. When the amount of antigen and antibody in the reaction system is just right, the reaction is in a half-saturated state after reaching equilibrium, at this time [AB]=[A], then Kd=[A][B]/[AB]=[B ]. In the half-saturated state, if the antibody concentration is very low and the reaction consumes very little antigen, the free antigen concentration [B] after the reaction is approximately equal to the total antibody concentration [B], at this time Kd=[B]≈Total [B]. Therefore, as long as the antibody concentration is low, the antigen concentration total [B] that can reach the half-saturated state after the reaction equilibrium is found, the dissociation constant can be obtained.
The accuracy of the Kd value measured by the competitive ELISA method depends on a major premise:after the reaction mixture was added to antigen-coated plates, the combine between free antibody and antigen do not destroy the balance of antigen-antibody reaction system (if the antigen plate If the concentration of medium antigen is too high and the bound free antibody exceeds a certain amount, the balance of the antigen-antibody reaction system will be destroyed. At this time, the measured OD value is too large, which will eventually lead to a large result). Normally, the maximum free antibody amount allowed to bind to the antigen plate is 10%. When performing an ELISA method to detect antibody affinity, it is necessary to ensure that the antigen does not disrupt the balance of the reaction system.
Operation Method
- Add sample: Add the standard working solution to the first two rows of wells, 50 μL per well. Among them, each concentration of working fluid is provided with a repeating hole. Then add the sample to be tested to other wells, 50 μLper hole (if the sample concentration is higher than the detection range, it needs to be diluted with the standard product & sample diluent to sample). Immediately add 50μL of the prepared biotinylated antibody working solution to each well. After the liquid is mixed, cover the ELISA plate and incubate at 37°C for 45 minutes. Tip: When adding the sample, add the sample to the bottom of the ELISA plate, try not to touch the wall of the well, gently shake and mix to avoid air bubbles. The sample addition time should be controlled within 10 minutes.
- Washing: Remove the liquid in the wells, add 350 μL of washing solution to each well, soak for 1-2 minutes, suck or shake off the liquid in the microplate, and pat dry on thick absorbent paper. Repeat this washing step 3 times. Tip: ELISA plate washer can be used here and other washing steps. Washing thoroughly at each step is the foundation of the experiment.
- Add HRP enzyme conjugate: add 100μL of enzyme conjugate working solution to each well. After the liquid is mixed, covered the film at plate and incubate at 37°C for 30 minutes.
- Washing: discard the liquid in the well, wash the plate 5 times, the method is the same as step 2.
- Add substrate: add 90μL of substrate solution (TMB) to each well. After mixing, coveredthe film at plate and incubate at 37°C in the dark for about 15 minutes. Tip: According to the actual color development, shorten or extend the incubation time as appropriate, but not more than 30 minutes. When the standard hole has a significant gradient, it can be terminated.
- Stop: add 50 μL stop solution to each well to stop the reaction. Tip: The order of adding the stop solution should be the same as the order of adding the substrate solution.
- Read the value: immediately use a microplate reader to measure the optical density (OD value) of each well at 450 nm wavelength. The microplate reader should be turned on in advance to warm up, and the detection program should be set up.
- After the experiment is completed, put the unused reagents back into the refrigerator at the specified storage temperature.
Curve Fitting
Generally, the purchased ELISA product manual will recommend the user a suitable method of fitting the curve, and the user can draw it with software or make it through excel. According to scientific analysis methods, if there are singularities or stains, linear analysis is not very good, and several points of the fitting curve should be selected. At the same time, double logarithmic straight line fitting or four-parameter curve fitting can be used instead.
Linear Regression
Linear regression is the simplest regression model and the most basic curve fitting regression analysis method. All test points are fitted to a straight line, and the fitting function equation is: y=a+bx.
Quadratic Polynomial Fitting Regression Equation
If the linearity of the straight line is not ideal, it is recommended to use a quadratic polynomial to fit the regression equation: the quadratic polynomial is parabolic, and the opening is downward or upward. In many ELISA experiments, the fitting is similar to the ascending or descending segment of the quadratic polynomial , So when using quadratic polynomial fitting, it is best to ensure that the range of values falls on the ascending or descending segment of the curve. The fitting function equation is: y=ax2+bx+c.
Logarithmic Fit Regression Equation
If the O.D measurement value of the standard product is set as the x-axis, the logarithm of the standard concentration is the y-axis, the concentration is the independent variable, and the O.D. value is the dependent variable for curve fitting.
Four-parameter Fitted Regression Equation
In addition, a four-parameter fitting regression equation can also be used: both the competition method and the sandwich method can be used. Its shape, depending on the situation, may be a monotonously rising exponential, logarithmic, or hyperbolic curve, it may also be a monotonously falling the above-mentioned curve, or an S-shaped curve. It requires that the value of X cannot be less than 0 (because the exponent is a real number, it has this requirement). In many cases, it can fit the reaction curve of ELISA, so it has become one of the most widely used models in ELISA.
Experimental skills
- Positive results in negative control
- Samples and reagents are contaminated, or improper operation during sample addition leads to cross-contamination of solution splashes between adjacent wells; in this case, reagents need to be replaced and handled carefully.
- The ELISA plate is not washed thoroughly; pour out the antibody solution before washing the plate, and then pour the washing solution over the wells to ensure sufficient washing.
- Excessive amount of antibody leads to non-specific binding; use the antibody according to the recommended amount in the instructions and dilute the antibody to an appropriate concentration.
- The overall background of the microtiter plate is high
- Antibody non-specific binding; make sure that the wells are blocked and the appropriate blocking solution is used to prevent non-specific binding.
- The substrate binding concentration is too high; properly dilute the substrate.
- The reaction time is too long; when the color of the microtiter plate is sufficient for absorbance reading, stop the reaction immediately with the stop solution and shorten the color time appropriately.
- The substrate solution is contaminated; the normal substrate solution should be clear and transparent. If yellow or other colors appear to indicate contamination, the substrate solution should be replaced with a new one.
- The substrate incubation process is not protected from light; the substrate incubation should be carried out under dark conditions.
- Poor repeatability between multiple holes
- The number of samples is irregular, and the sample addition time is different; try to keep the sample addition time close to the first time when adding duplicate holes.
- The amount of sample added is inconsistent; the sample should be mixed thoroughly before dilution and the same pipette should be used.
- The washing conditions and operators are inconsistent; when repeating the measurement of samples, the operating conditions and personnel should be as consistent as possible the last time.
- High or low absorbance
- If the content of the antigen to be tested in the sample is too low, the result will be low; try to increase the amount of sample used.
- Adding an inappropriate amount of antibody will result in low or high results; use the recommended amount of antibody or adjust the most suitable amount of antibody as much as possible for better results.
- Too short incubation time leads to low test results; appropriately extend the incubation time of the antibody or antigen to ensure that the test sample can fully bind to the detection antibody.
- The incubation temperature is not suitable; it should be ensured that the antibody is incubated under the most suitable conditions (generally incubate at 37°C for 1 hour).