Drug Resistance Mechanism Analysis
What Is Drug Resistance Mechanism Analysis?
The analysis of drug resistance mechanisms investigates how tumor cells gain resistance to pharmaceutical treatments. The intrinsic mechanisms of tumor cell resistance become evident through analysis of molecular changes occurring during drug treatment. This is crucial for developing more effective cancer treatment strategies.
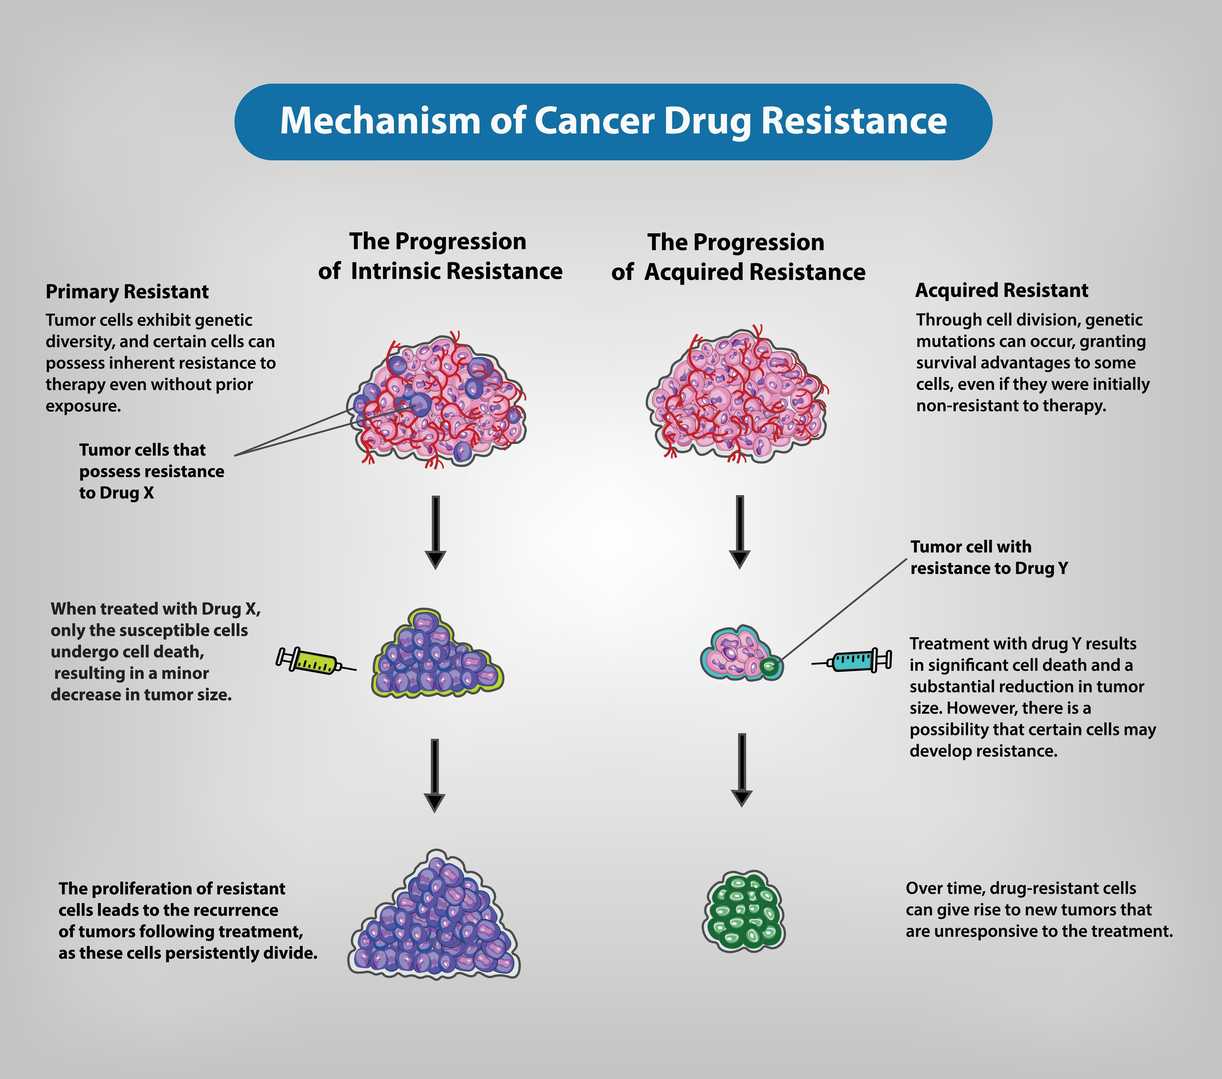
Understanding drug resistance mechanisms is essential for:
- Predicting Drug Efficacy: Knowledge of drug resistance biomarkers allows scientists to forecast patient responses to specific medications.
- Overcoming Drug Resistance: Scientists develop treatment approaches that combat drug resistance mechanisms through combination therapies and novel inhibitors.
- Personalized Treatment: Therapeutic results improve when treatment plans are tailored to address unique resistance mechanisms in patients.
- New Drug Development: The pursuit of novel drug targets leads to the creation of superior anti-cancer medications.
Drug Resistance Mechanism Analysis Services
Our services offer:
- In Vitro Drug Testing: We can investigate the effect of a given drug utilizing primary cells extracted from patients suffering from various hematologic malignancies.
- IC50 Determination: Determining the half maximal inhibitory concentration.
- Apoptosis Characterization
- Cell Cycle Characterization
- DNA Damage Characterization
- Drug Combination Screening
- Drug Resistance Gene Analysis: Providing a variety of antibiotic resistance gene analysis services based on sequencing, PCR, and chip platforms that are fast.
- Drug Sensitivity Testing (DSRT): Detecting pharmacological dependencies in cancer cells.
Array Example
| Panel / Focus | Example Marker Combination | Target Application | Possible Sample Preparation |
| A. Predicting Drug Efficacy | - Signaling Pathway proteins (EGFR, HER2, PI3K/Akt, MAPK/ERK, mTOR, JAK/STAT) - Phospho-specific versions (p-Akt, p-ERK, p-STAT3, p-mTOR) - Apoptotic markers (Bcl-2, Bax, Mcl-1) | 1. Gauge tumor or cell line's baseline activation states 2. Predict response to targeted therapies (e.g., anti-HER2 if HER2 high, or MEK inhibitors if p-ERK is elevated) 3. Personalize therapy choices | - In vitro: Cell lysates (drug-naive or short stimulation) to see baseline signals - In vivo: Biopsy/tumor tissue homogenates for phospho and total protein levels |
| B. Overcoming Drug Resistance | - Efflux transporters: P-gp (ABCB1), MRP1 (ABCC1), BCRP (ABCG2) - Alternate signaling or bypass nodes (AXL, IGF-1R, c-Met, FGFR) - Anti-apoptotic: Bcl-xL, Mcl-1 | 1. Identify mechanisms that reemerge after therapy (e.g., increased efflux, alternate RTKs) 2. Develop combination strategies (e.g., efflux inhibitor + main drug) 3. Determine synergy with second-line targeted inhibitors | - In vitro: Drug-resistant cell lines or subclones; measure transporter or bypass marker expression - In vivo: Tumor xenografts post-prolonged drug treatment; measure expression changes at relapse |
| C. DNA Damage Characterization | - DNA repair factors: ATM, ATR, BRCA1, RAD51, PARP1 - Damage sensors: γ-H2AX (DSBs), p53, p21 - Cell cycle regulators: Cyclin-dependent kinases (CDK1/2), Cyclins (A, B, E) | 1. Elucidate if resistance is linked to enhanced DNA repair (e.g., BRCA1 upregulation) 2. Track DNA damage accumulation (γ-H2AX) vs. repair activation (RAD51) 3. Correlate p53 status with drug response (platinum, alkylators) | - In vitro: Cancer cell lines exposed to genotoxic agents, collect lysates/time-course - In vivo: Tumor tissues from chemo-treated animals; measure repair protein induction, double-strand break signals, p53 status |
| D. Drug Combination Screening | - Pathway readouts: p-ERK, p-Akt, p-S6, p-STAT3, etc. - Cell viability or apoptosis markers (caspase-3 cleavage, PARP) - Inflammatory signals if immunotherapy combos (TNF-α, IFN-γ) | 1. High-throughput synergy screens (e.g., MEK + PI3K inhibitors, or chemo + checkpoint inhibitors) 2. Assess additive vs. synergistic pathway shutdown (e.g., p-ERK + p-Akt) | - In vitro: Robotics-friendly array setups with multiple drug combos; measure cell lysates or supernatants - In vivo: Serum or tissue from combo-treated animals, though high-throughput is more common in vitro |
| E. Drug Resistance Gene Analysis | - Proteins from known resistance-related genes: ABC transporters, Bcl-2 family, MET, FGFR, EGFR, KRAS, etc. - Gene-coded array of suspected/known resistance factors | 1. Map upregulated proteins from common "resistance genes" sets (genomic hits → protein arrays) 2. Validate hits from transcriptomic or CRISPR screens at protein level | - In vitro: Resistant vs. parental cell line lysates; confirm overexpressed gene products - In vivo: Post-progression tumor samples from patients or xenografts, correlate gene expression with protein array data |
| F. Drug Sensitivity Testing (DSRT) | - Cell cycle & viability markers (Ki-67, Cyclins, cleaved caspases) - Cell stress (HSP70, HSP90, ROS defense enzymes) - Mitochondrial health markers (TOM20, TIM23) | 1. Profile how multiple drugs (or small library) affect cell proliferation, cycle distribution 2. Select best compound for synergy or minimal toxicity | - In vitro: 96-/384-well plate array systems + cell-based readouts (supernatant or lysate arrays), measure dose-response in parallel - In vivo: Less common for DSRT, but possible if collecting multiple tissues or timepoints in an animal-based mini-screen |
| G. Cell Cycle Characterization | - Cyclins (A, B, D, E), CDKs (CDK1, CDK2, CDK4, CDK6), Checkpoints (p21, p27, Chk1, Chk2) | 1. Define which checkpoint is inhibited or activated in resistant cells (G1/S, G2/M blockade) 2. Correlation with therapy that targets cell cycle (CDK inhibitors) | - In vitro: Lysates from synchronized vs. asynchronous cell populations ± drug - In vivo: Tumor samples can reveal cell cycle distribution changes under therapy, especially if combined with flow-based arrays or immunohistochemical data |
Protein Array's Near-Infrared Microarray Protein Chip Technology Platform
Protein Array offers a cutting-edge near-infrared microarray protein chip technology platform that enhances the capabilities of Drug Resistance Mechanism Analysis. We have established a unique protein array detection platform by combining laser confocal microscopy, near-infrared fluorescence labeling, and special functional silicone membrane technologies with protein chips. This platform provides strong technical support for drug resistance mechanism analysis.
The platform has the following advantages:
- High-Throughput Detection: Special functional silicone membranes enable high-throughput detection which allows the analysis of multiple samples at once and speeds up the research process.
- Multi-Index Joint Detection: The system allows for the concurrent detection of several protein indicators which helps to fully understand drug resistance mechanisms.
- High Cost-Effectiveness: Economical and efficient, reducing research costs.
Advantages of Drug Resistance Mechanism Analysis
- High Sensitivity: Able to detect low-abundance protein expression changes.
- High Accuracy: Advanced technology and strict quality control standards ensure accurate and reliable data.
- High Throughput: The system detects numerous samples and multiple indicators at the same time.
- High Degree of Automation: Reduces human error and improves efficiency.
Applications of Drug Resistance Mechanism Analysis
Drug resistance mechanism analysis can be widely used in the following fields:
- Oncology Drug Screening: Assess how well drug candidates perform and forecast possible resistance risks they might encounter.
- Drug Resistance Mechanism Research: The comprehensive analysis of tumor cell resistance mechanisms supports the creation of novel drugs.
- Clinical Diagnosis: The detection of drug resistance genes or proteins in patients helps determine appropriate clinical medication strategies.
- Personalized Treatment: Create customized treatment plans to enhance therapeutic results for patients.
Leveraging the advanced near-infrared microarray protein chip technology platform from Protein Array, Creative Diagnostics' advanced protein array technology platform together with our professional analysis team enables us to deliver top-notch drug resistance mechanism analysis services for cancer research and drug development to our customers.
- Custom Protein Arrays
- Drug Screening and Toxicity Assessment
- Immunoprofiling
- Oncology Drug Screening
- Signaling Pathway Analysis
- Spatial Multi-Omics and Targeted Proteomics
- Vaccine Development
- Antibody Profiling
- Protein-Protein Interaction Studies
- Allergen Screening
- Protein-Nucleic Acid Interaction Analysis