
Inquiry Basket
 Loading ......
Flow cytometry is a laser-based technique to count and analysis the size, shape and properties of individual cells within a heterogeneous population of cells. Flow cytometry is a widely used approach to phenotype the cells and to assessing the purity of isolated subpopulations. Predominantly, it is measured by the fluorescence intensity resulted from fluorescent-conjugated antibodies directly recognizing target proteins, or ligands specifically binding to molecules (such as DNA) within a cell. In addition, based on the properties of cells, a heterogeneous mixture of biological cells can be sorted into two or more containers by using a specialized type of flow cytometry called fluorescence-activated cell sorting (FACS).
Flow cytometry data is extremely quantitative, it provides fast, objective and simultaneous multi-parameter analysis of single cells as well as physical separation of cells of particular interest.
Suspensions of individual cells from cultured cells, tissues and organisms are prepared in tubes and then rapidly placed on a flow cytometer. Flow cytometer is constituted of five main components (Figure 1):
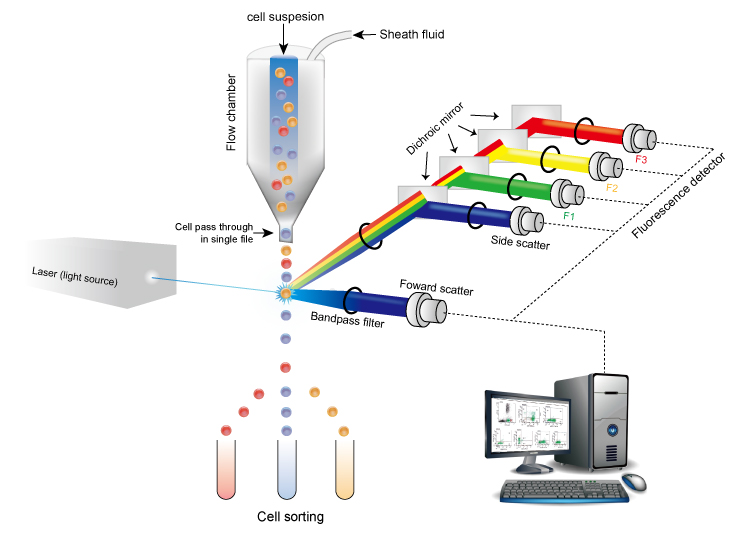 Figure 1. Schematic diagram of flow cytometer
Whem each cell passes the laser beam, the laser beam is scattering in all directions. The flow cytometer detects scatter in the forward manner called forward scatter, and lights in the sideways called side scatter. Forward scatter is proportional to the size of the cell, while side scatter is proportional to the granularity of the cell. By analysing the data of forward and side scatter together, cell populations can often be distinguished based on differences in their size, shape and internal complexity (Figure 2).
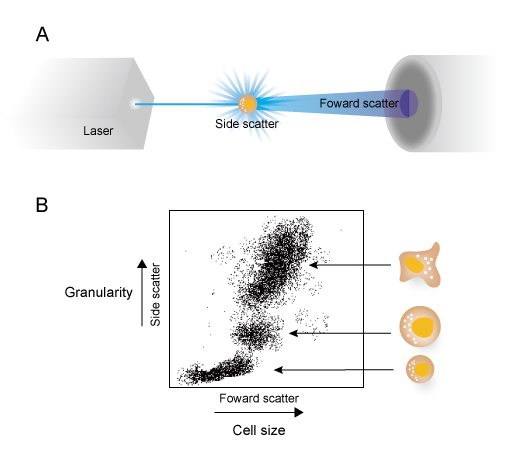 Figure 2. Measurement of forward and side scatter. Indivedual cells are divided according to the size and granularity within a heterogeneous population of cells.
In additon to identifying the size and granularity of cells, flow cytometry provides cell phenotyping by using fluorescent-labeled antibodies directly against surface markers. Simultaneously, flow cytometry executes intracellular analysis with antibodies or ligands detecting multiple intracelluar targets including proteins and nucleic acids.
Fluorochromes are excited by a laser with the corresponding excitation wavelength when the cells pass the laser beam. The light emitted from the fluorochrome is splitted into defined wavelengths and directed along a path by a set of filters and mirrors within the flow cytometer. The fluorescent light is filtered so that each sensor will detect fluorescence only at a specified wavelength. In such manner, flow cytometer can quantify the relative amount of a fluorochrome and detect light from multiple fluorochromes within a cell (Figure 3).
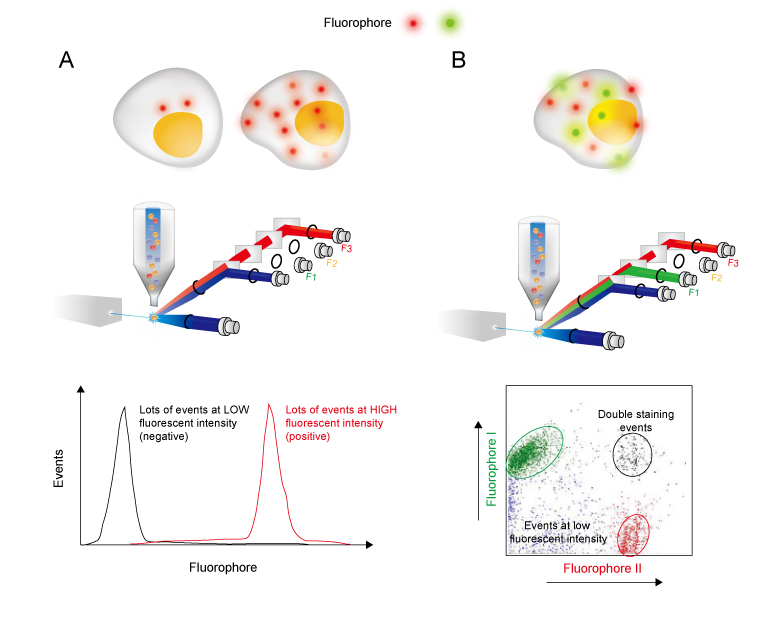 Figure 3. Measurement of fluorescence signaling. (A) Fluorescence intensity measurement. Negative results are shown as no or low fluorescent intensity (black line) and positive results have a large number of events at high fluorescence intensity (red line). (B) Example of multiple fluorochromes detecting. Cells are divided into four subpopulations: negative (blue), single staining (green or red) and double staining events (black).
Single-cell suspension is prepared in staining buffer and then cells are incubated with fluorochromes. There are two types of staining: direct and indirect staining.
One primary antibody labeled with fluorophore or one fluorescence dye that directly detecting the target. In this manner, direct staining is highly efficient with one staining step and without non-specific binding from a secondary antibody.
Two antibodies are involved: the primary antibody that recognizing the targets is not fluorophore-labeled but is detected by a fluorophore-conjugated secondary antibody . Since a wide range of fluorescence-conjugated antibodies is available, the combination of primary and fluorophore-labeled secondary antibodies provides brand choices to meet researchers' need.
Direct staining is recommended for intracellular staining, where large complexes like secondary antibodies are difficult to enter the cell, which causing non-specific binding or failure of primary antibody detection. The first step for intracellular flow cytometry is fixation which immobilizes proteins and preserves the transient signaling events. Cells are then permeated to allow fluorochromes access to the intracellular space. A successful intracellular staining requires optimized fixation and permeabilization procedures that depended on the location and biochemistry of the targets.
The fluorochromes are usually fluorescence-conjugated antibodies or fluorescence dyes. Table 1 displays parameters of part fluorochromes used for flow cytometry. Highly expressed antigens will usually be detected and easy to be resolved from the negative control with almost any fluorochrome. While, antigen with lower expression level require the higher signal to background ratio provided by a brighter fluorochromes to separate the positive cells adequately from the unstained cells. The fluorochromes should be selected depending on the instrument and target epitopes.
Table 1. Parts of fluorochromes involved in flow cytometry.
| Fluorochrom | Abbrev | Absorption max. nm | Emission max. nm | Emission color | Brightness |
| Violet laser diode | |||||
| Alexa 405 | 401 | 421 | + | ||
| Pacific blue | 405 | 456 | ++ | ||
| Argon-ion laser | |||||
| Fluorescein | FITC | 495 | 520 | +++ | |
| Alexa 488 | 488 | 520 | +++ | ||
| R-phycoerythin | PE | 495 564 | 576 | +++++ | |
| PE-Texas Red | ECD | 495 564 | 620 | +++ | |
| PE-cyanine 5 | PC5 | 495 564 | 670 | ++++ | |
| Peridinin-chlorophyll | PerCP | 490 | 677 | ++ | |
| PE-cyanine 5.5 | PC5.5 | 495 564 | 696 | +++ | |
| PE-cyanine 7 | PC7 | 495 564 | 767 | ++++ | |
| He-Ne laser | |||||
| Allophycocyanin | APC | 650 | 660 | +++++ | |
| APC-cyanine 5.5 | APC-Cy5.5 | 650 | 710 | +++ | |
| APC-cyanine 7 | APC-Cy7 | 650 | 767 | ++ | |
References
Loading ......
